Healthcare security and compliance

§1Case studies
Three hospitals, two clinic groups and one imaging and lab network. Each case shows what we found, how long it took and what the units noticed. Fictional clients, demo data.
§2Read the cases
§3Side by side
Case, sample | What we counted | Time | Result |
Drill findings: Critical 2, High 9, Low 31 | 38 minutes to contain | Risk analysis closed out | |
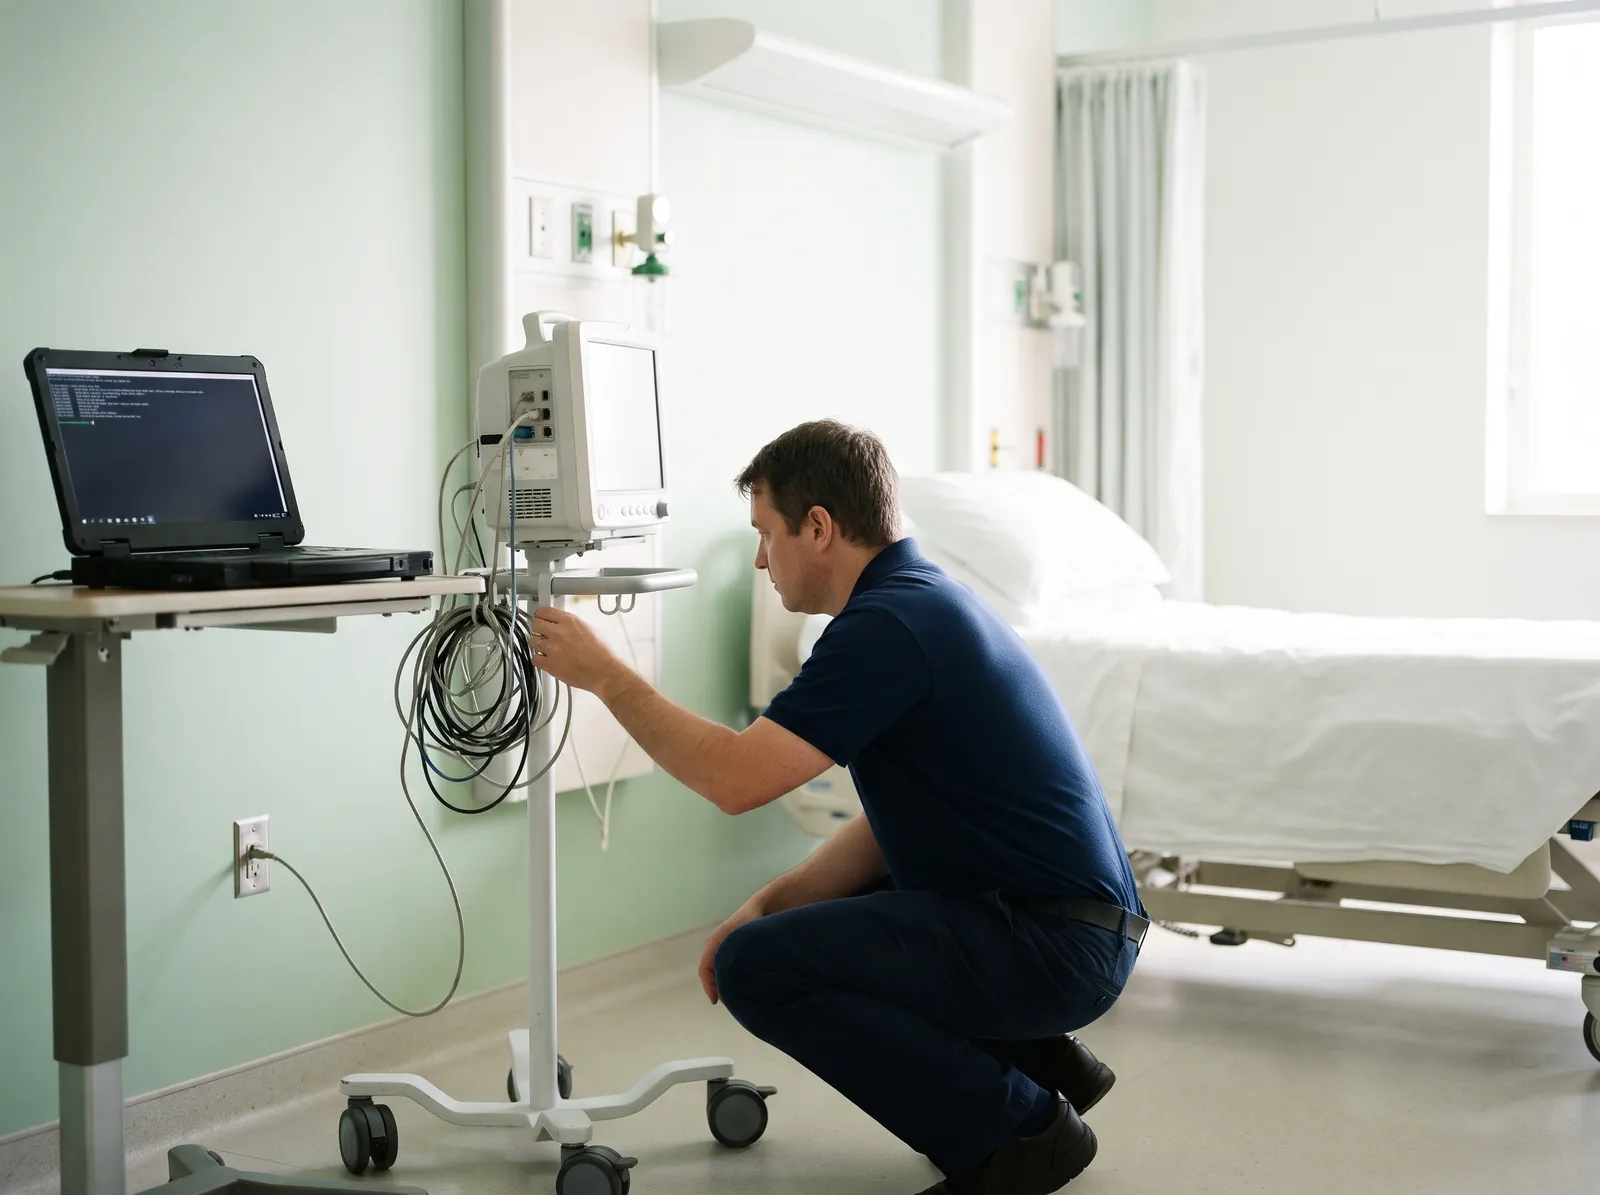
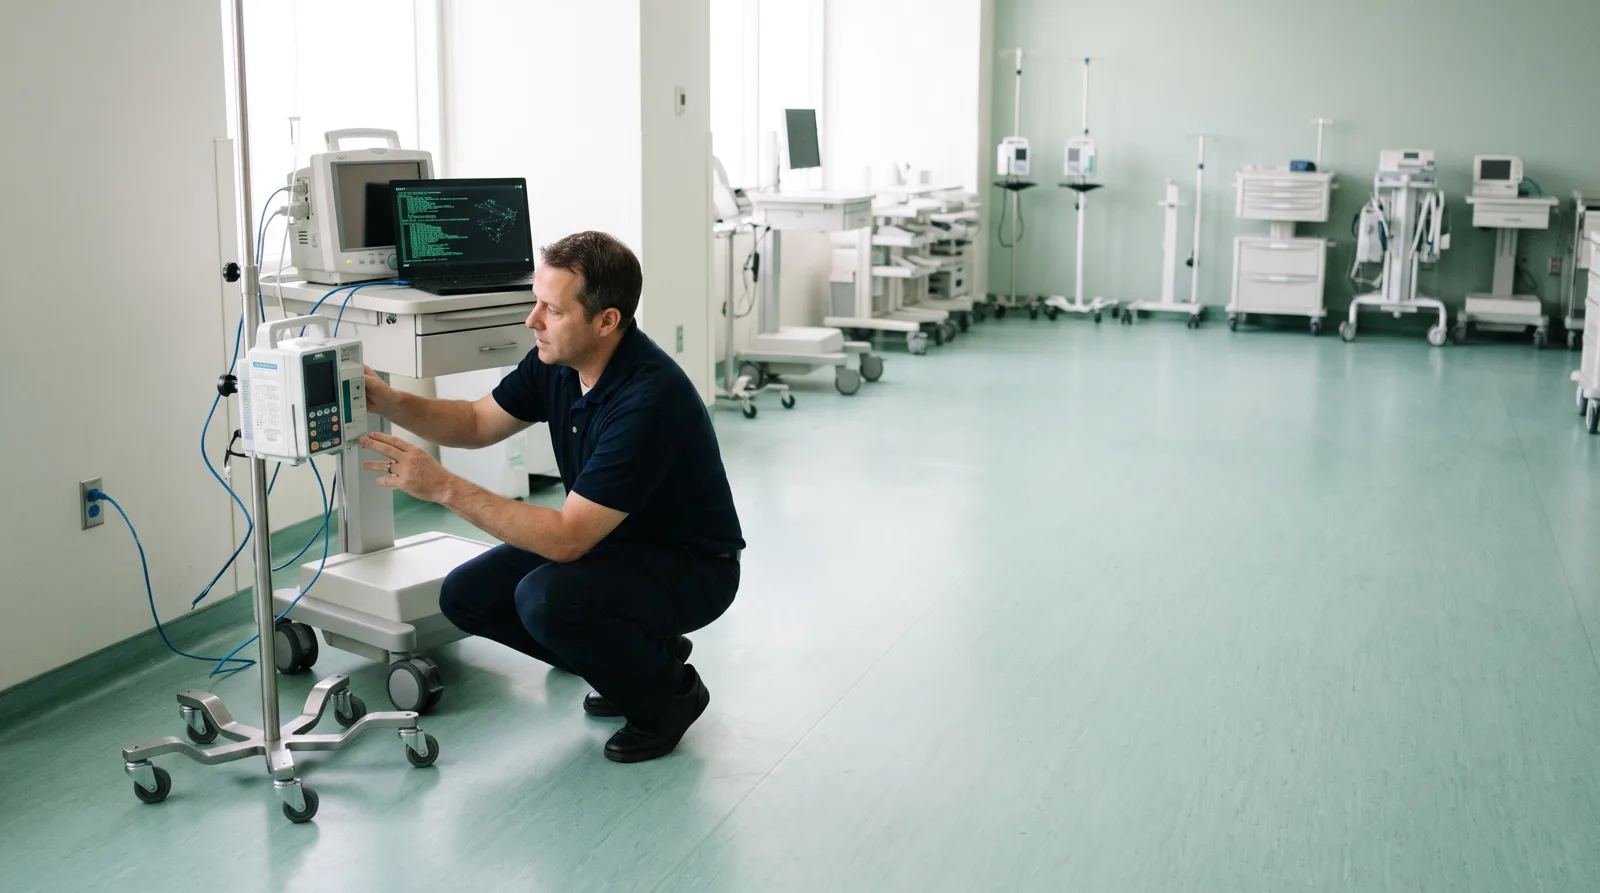
Devices on vendor hold segmented, 318 of 318 | 11 weeks | No device software changed | |
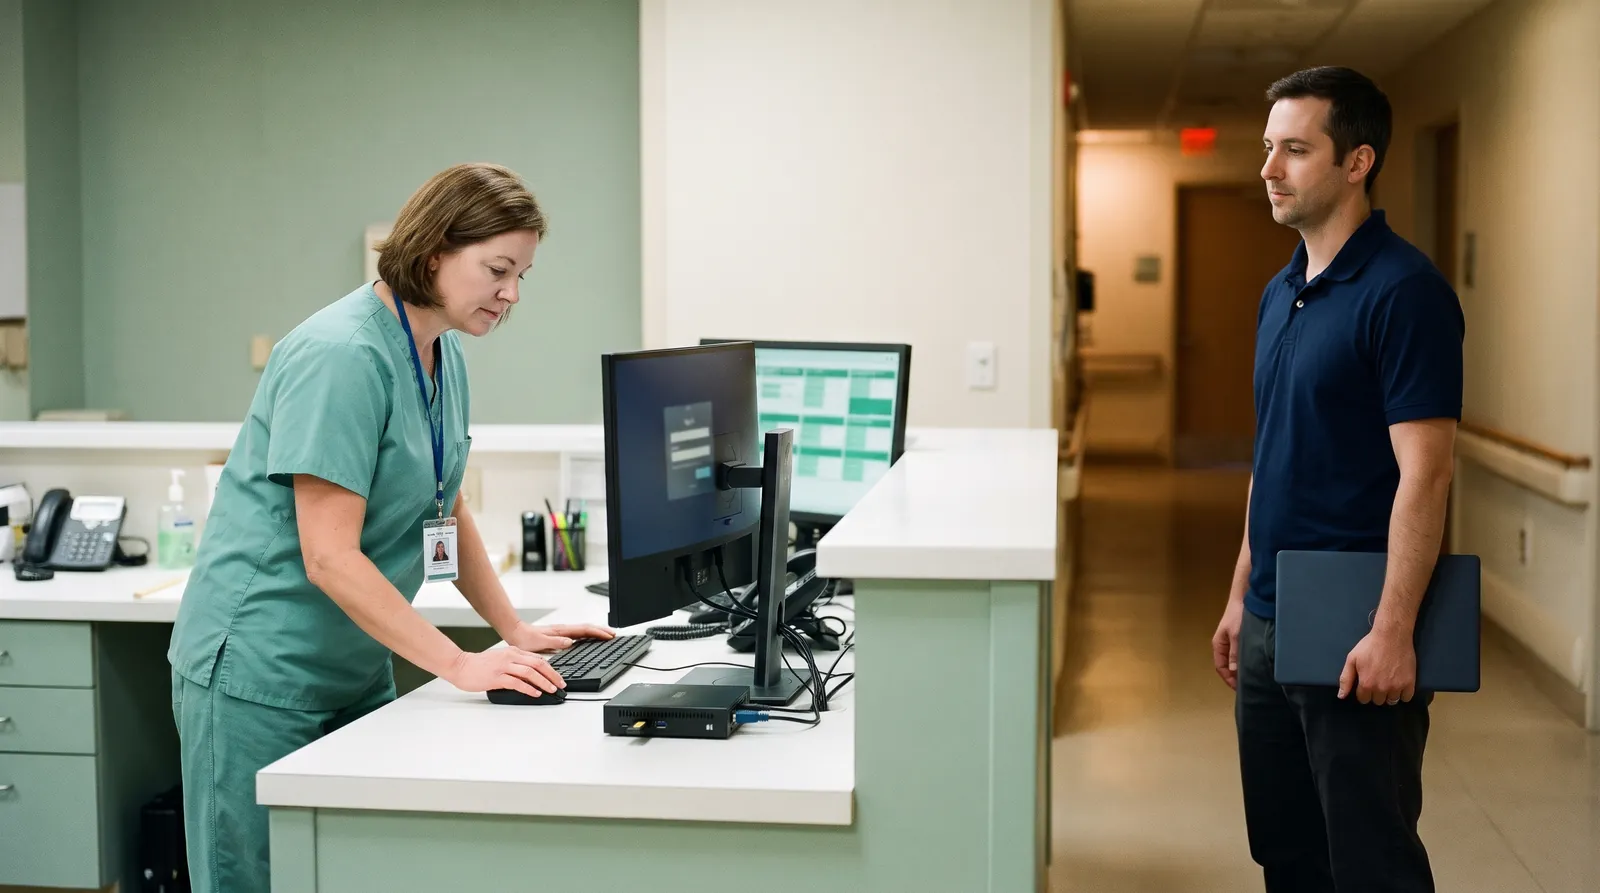
Shared logins, 38 to 0 | 6 weeks | About six seconds to sign in | |
Gaps, 57 found, 51 closed in a year | 10 weeks | An owner and a date for every gap | |
Runbook steps with no owner, 7 to 0 | 2 tabletop sessions | Notices ready by day 30 | |
Findings: Critical 1, High 6, Low 14 | 14 night windows | Vendor access by request only |
Fictional clients, demo data.
§4Sample report
Pick a risk analysis extract, a device inventory, a change window plan or a drill report. Every sample is fictional, with no patient data in it.