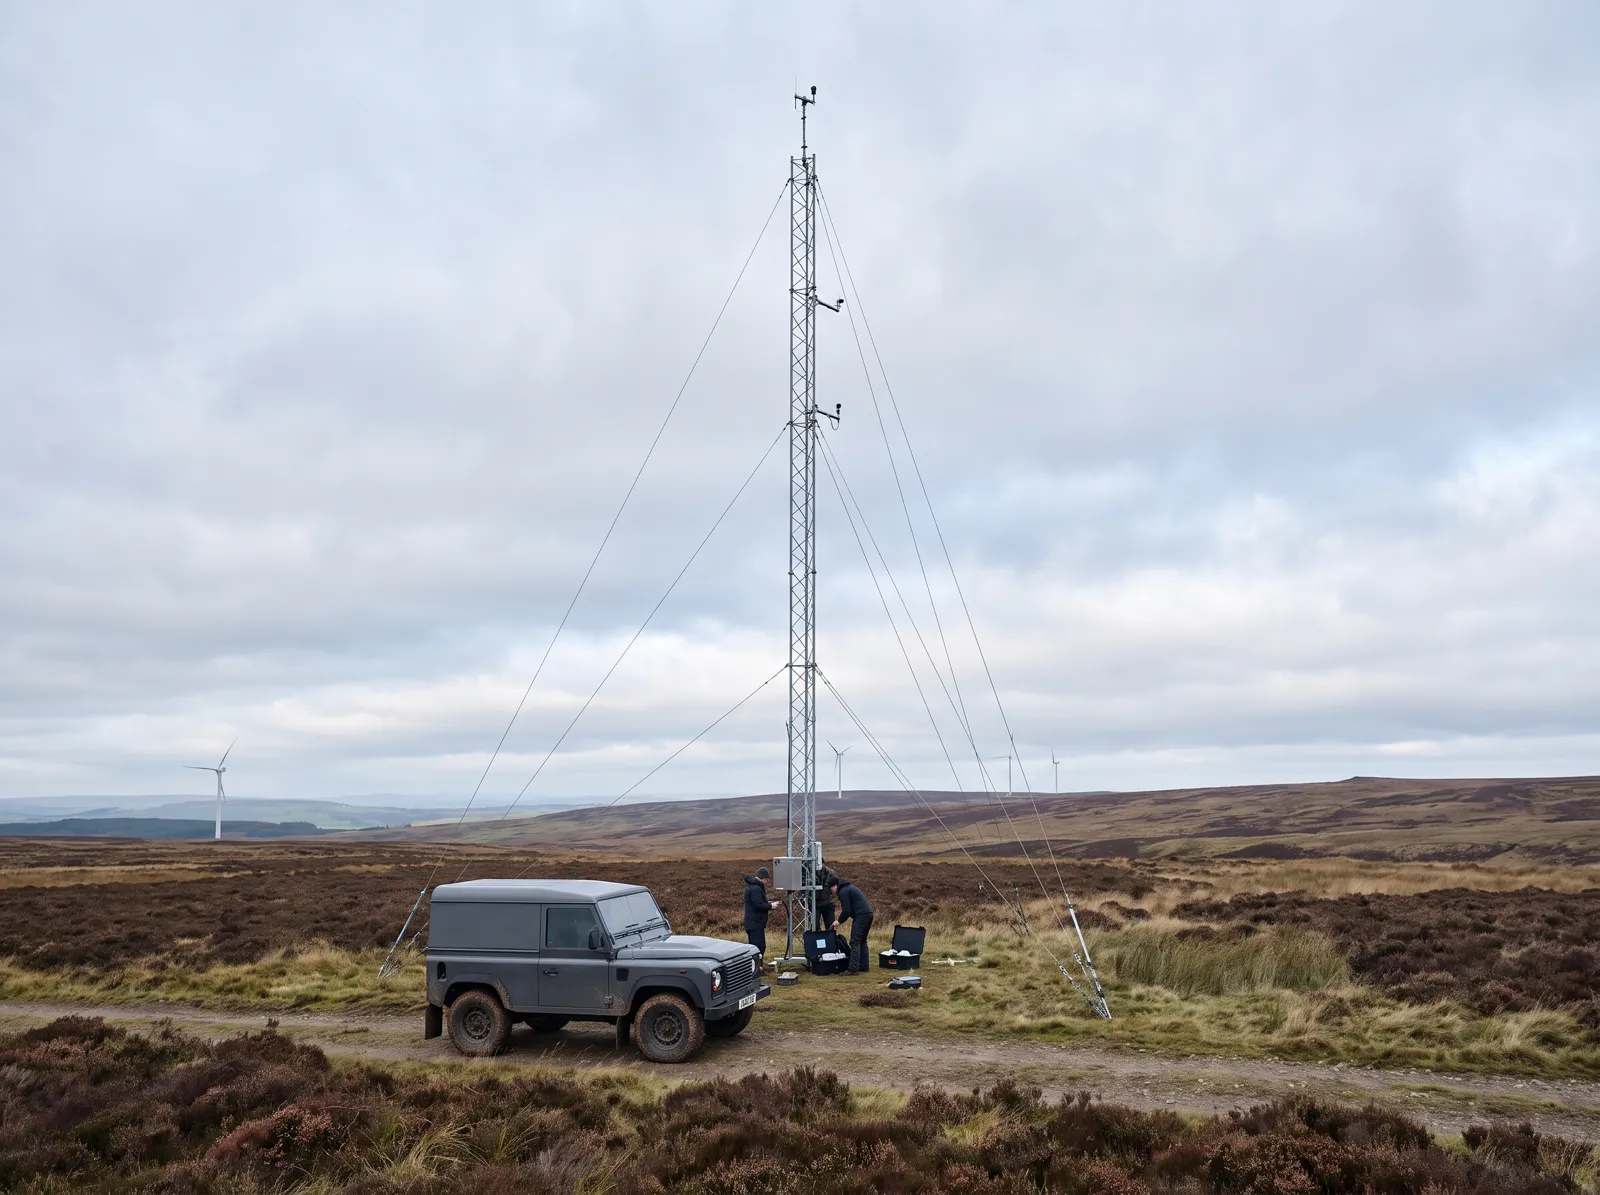
Before Hartfell Edge had a single foundation, our ecologists and engineers spent two years on the ridge counting bats, metering sound and mapping springs. Here is what they found — and what we changed because of it.
Every study for Hartfell Edge: what it measured, what it found and what we changed because of it. The same register is attached to the county permit.
STUDY | METHOD | SCOPE | RESULT | WHAT CHANGED | STATUS |
ENV-01 Birds & Bats | Vantage points + radar | 24 months | Dusk flight line found | 2 turbines moved | ACTIVE |
ENV-02 Noise | Model + meters | 46 homes | ≤ 35 dB(A) at homes | Night blade mode | MONITORED |
ENV-03 Shadow Flicker | Model + light sensors | Every home | 0 hrs / yr at homes | Sensors stop blades | ACTIVE |
ENV-04 Landscape | Photomontages | 18 viewpoints | 18 views published | Spaced from Mill Rd | PUBLISHED |
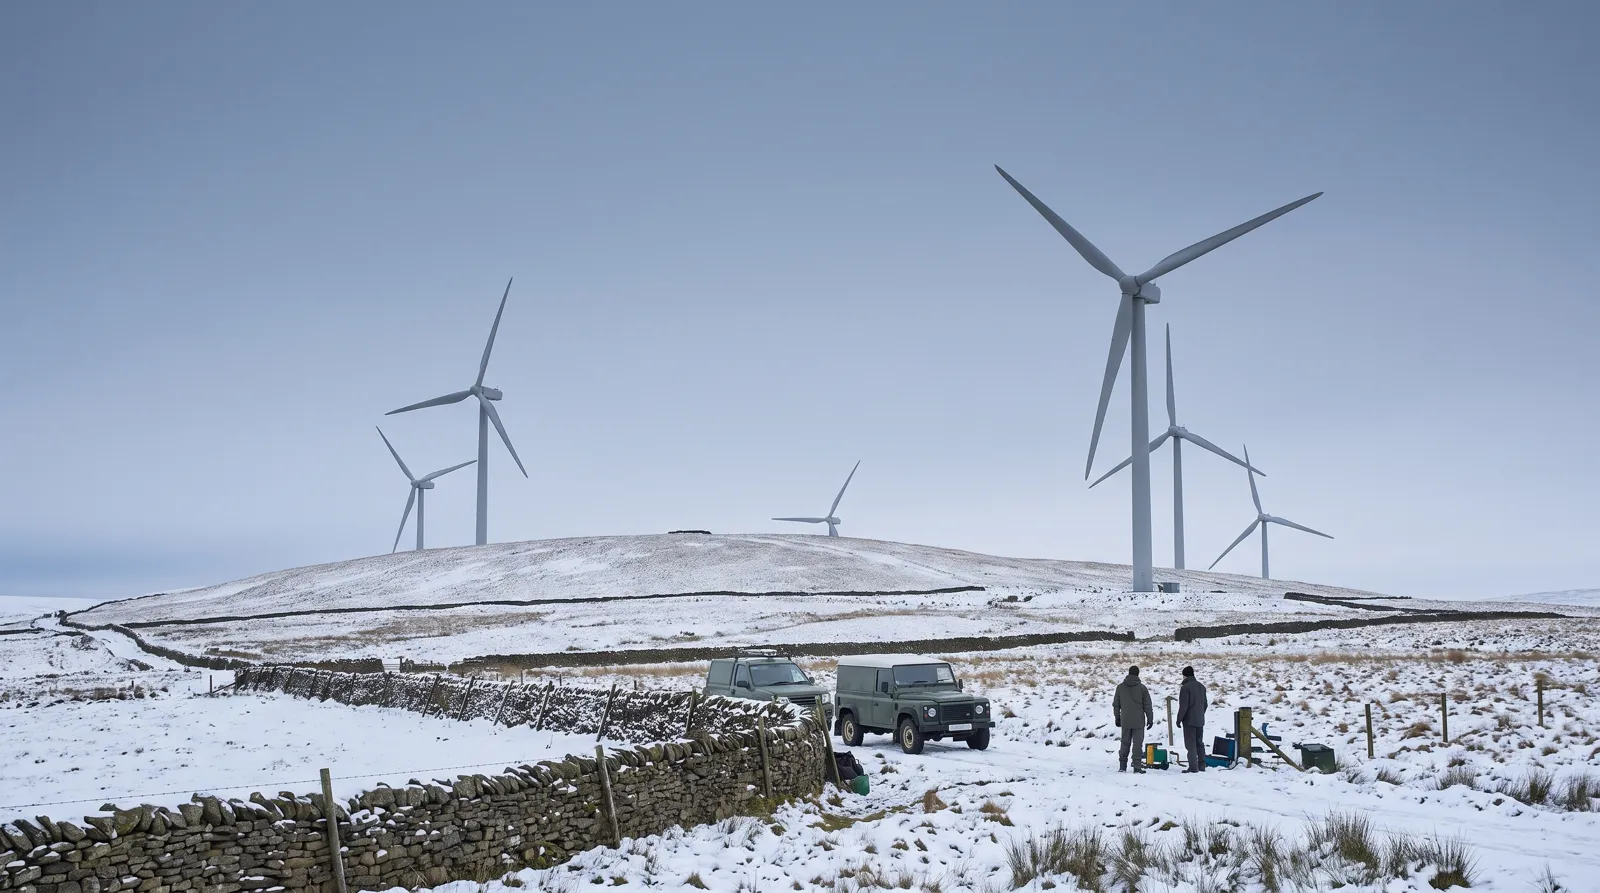
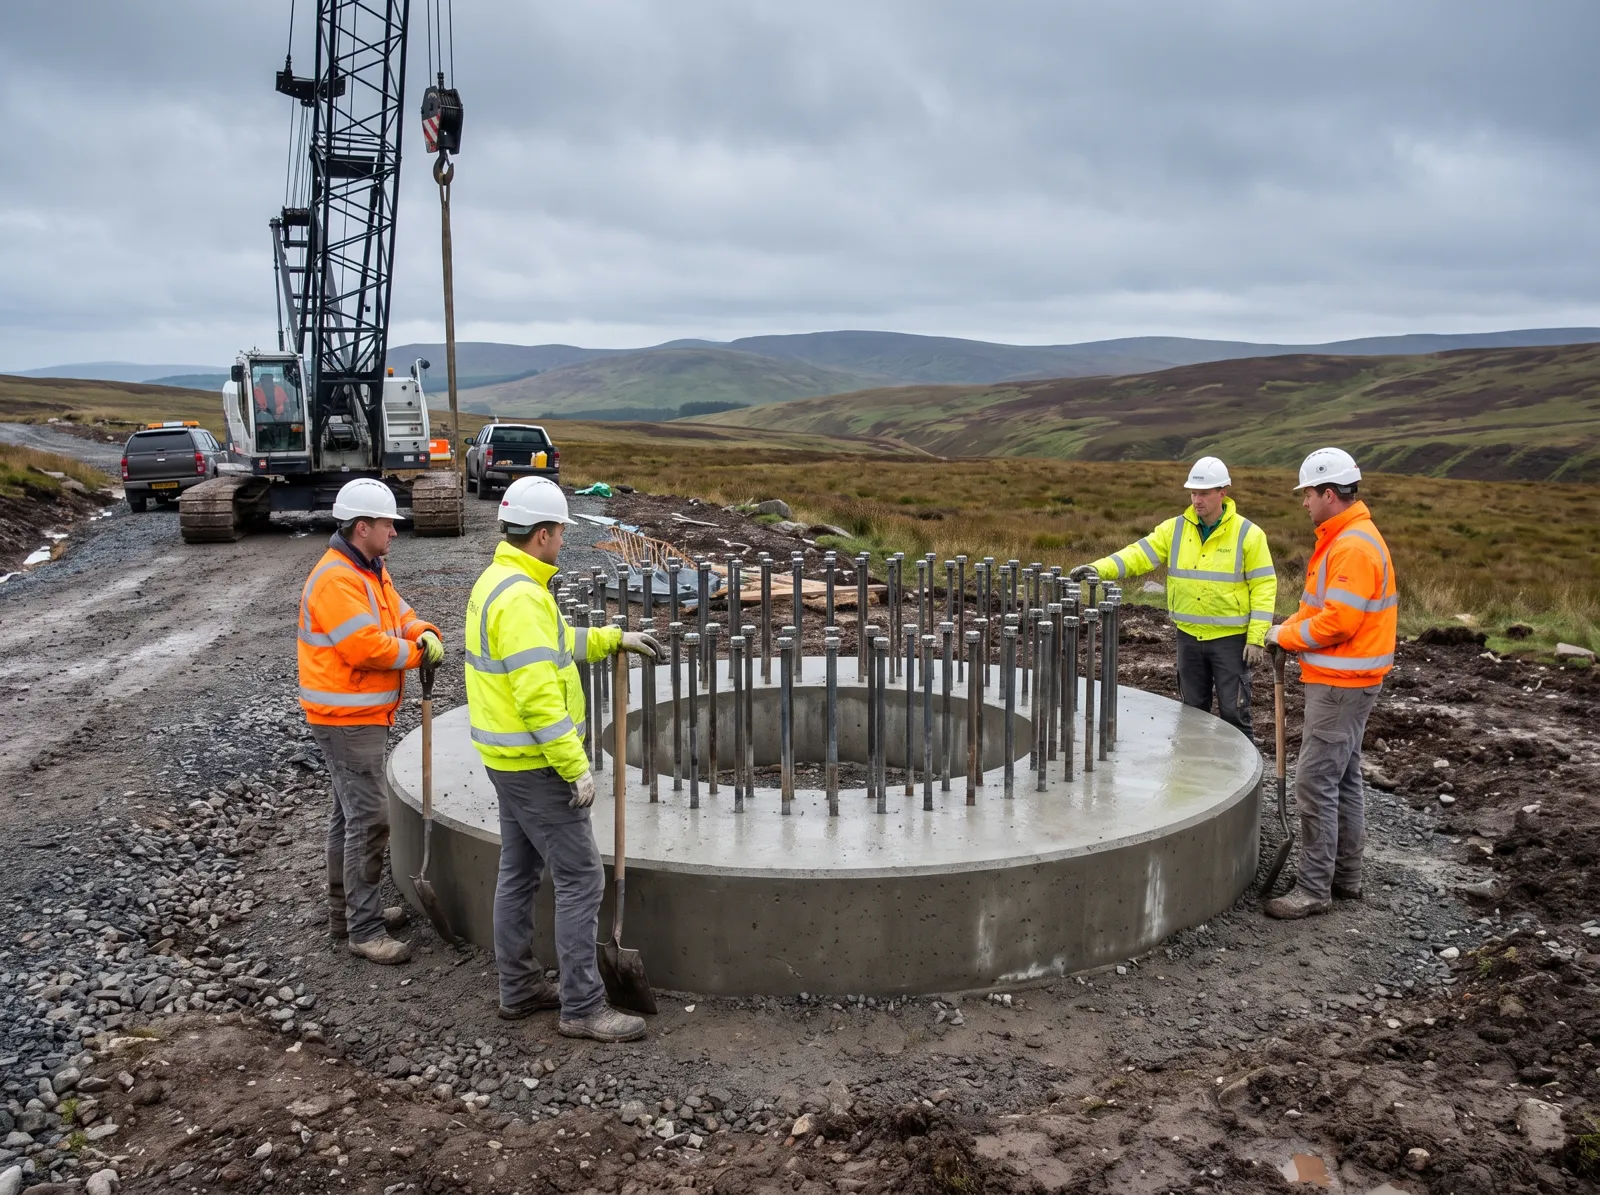
ENV-05 Water & Soils | Spring survey | 12 springs | 250 m buffer kept | Track rerouted | MONITORED |
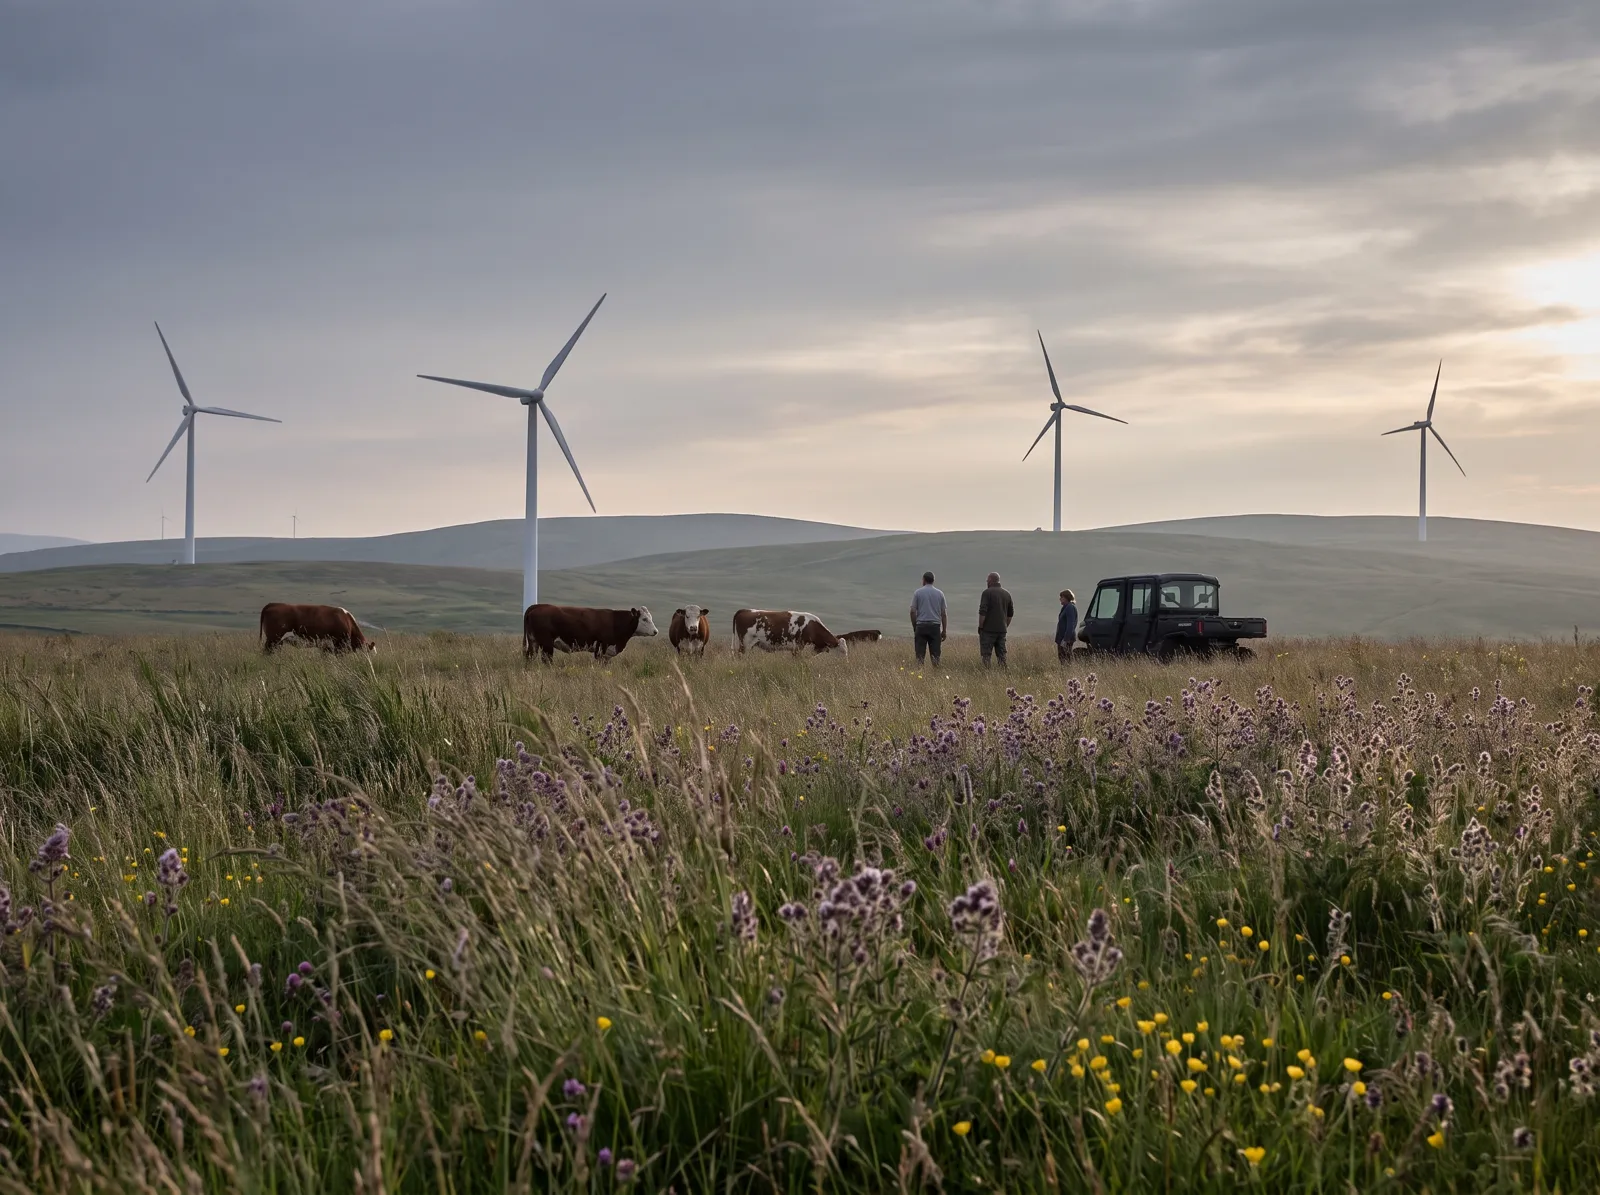
ENV-06 Habitat | Prairie restoration | 64 acres | 3 : 1 ratio | Local herds graze | ACTIVE |
Each card opens the farm the study shaped. The full reports — methods, raw counts and all — are free from the site office.
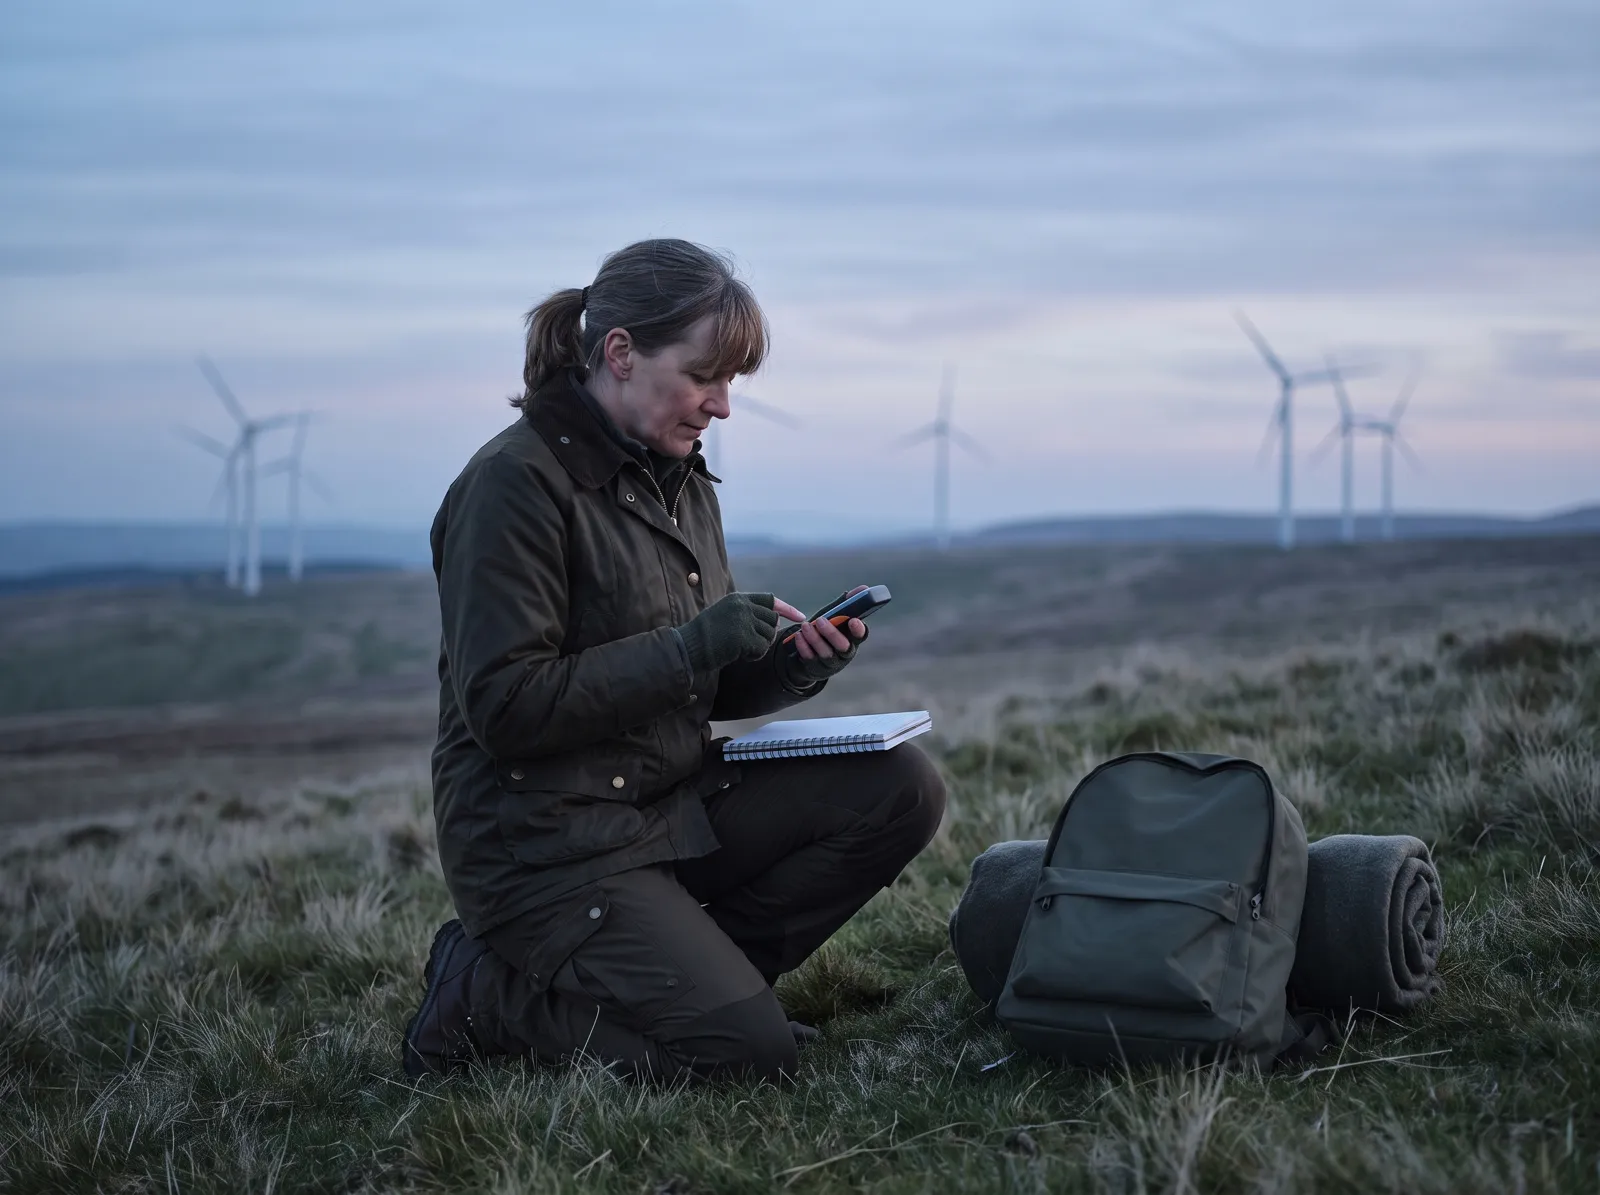
Vantage-point counts and bat radar. Two turbines moved 140 m off a dusk flight line; blades slow on warm evenings, Apr–Oct.
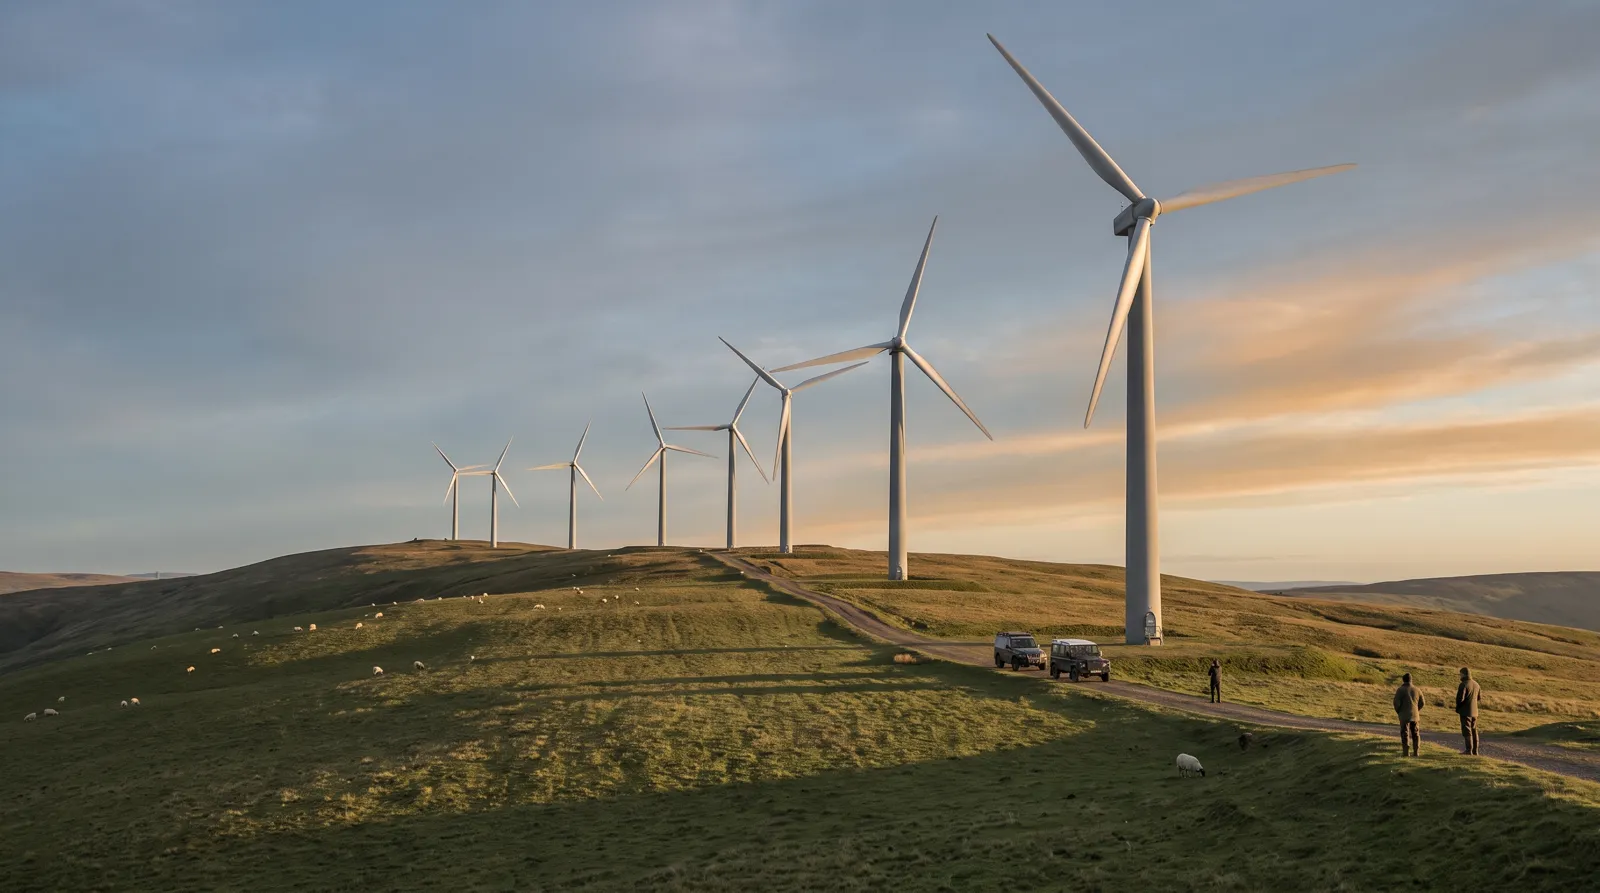
Modelled at every home within 1.5 miles, then checked with meters at eight of them before and after.
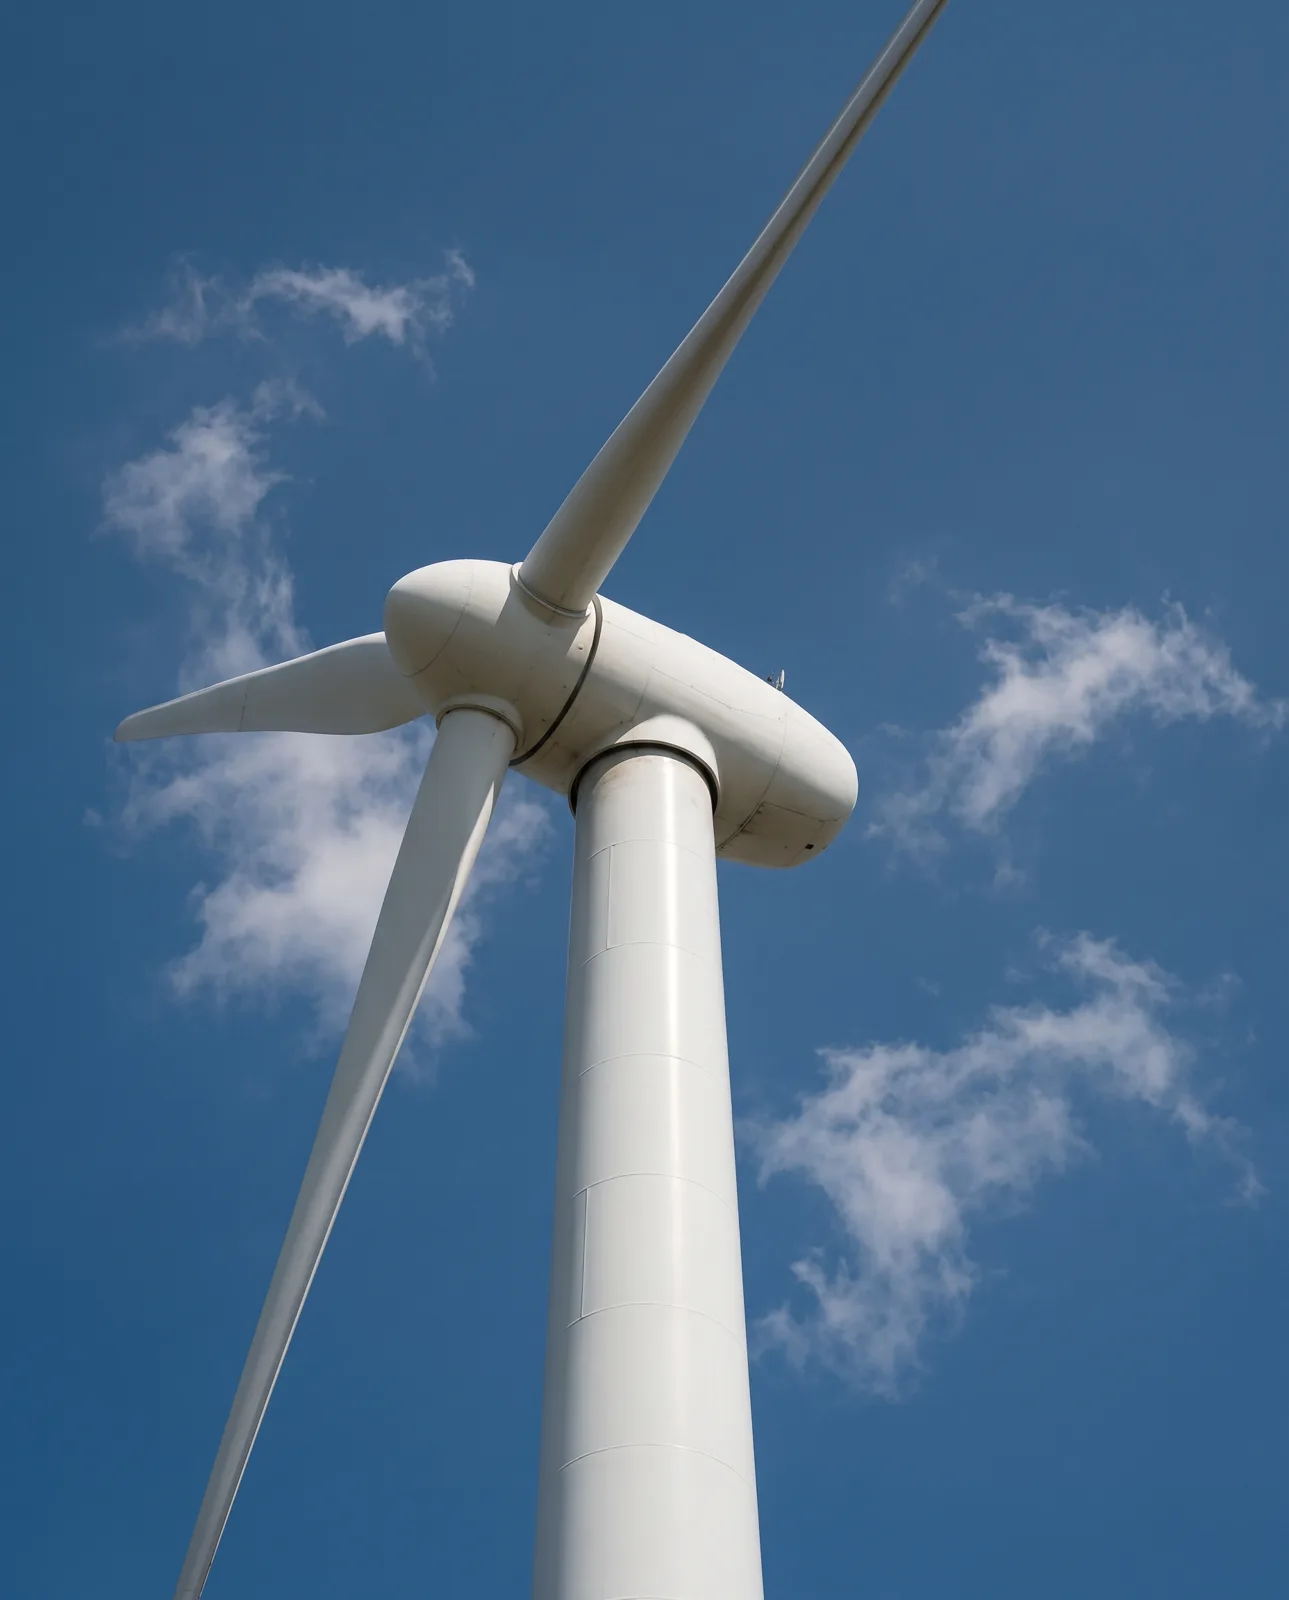
Light sensors stop the blades whenever a shadow would cross a window. Modelled hours at homes: zero.
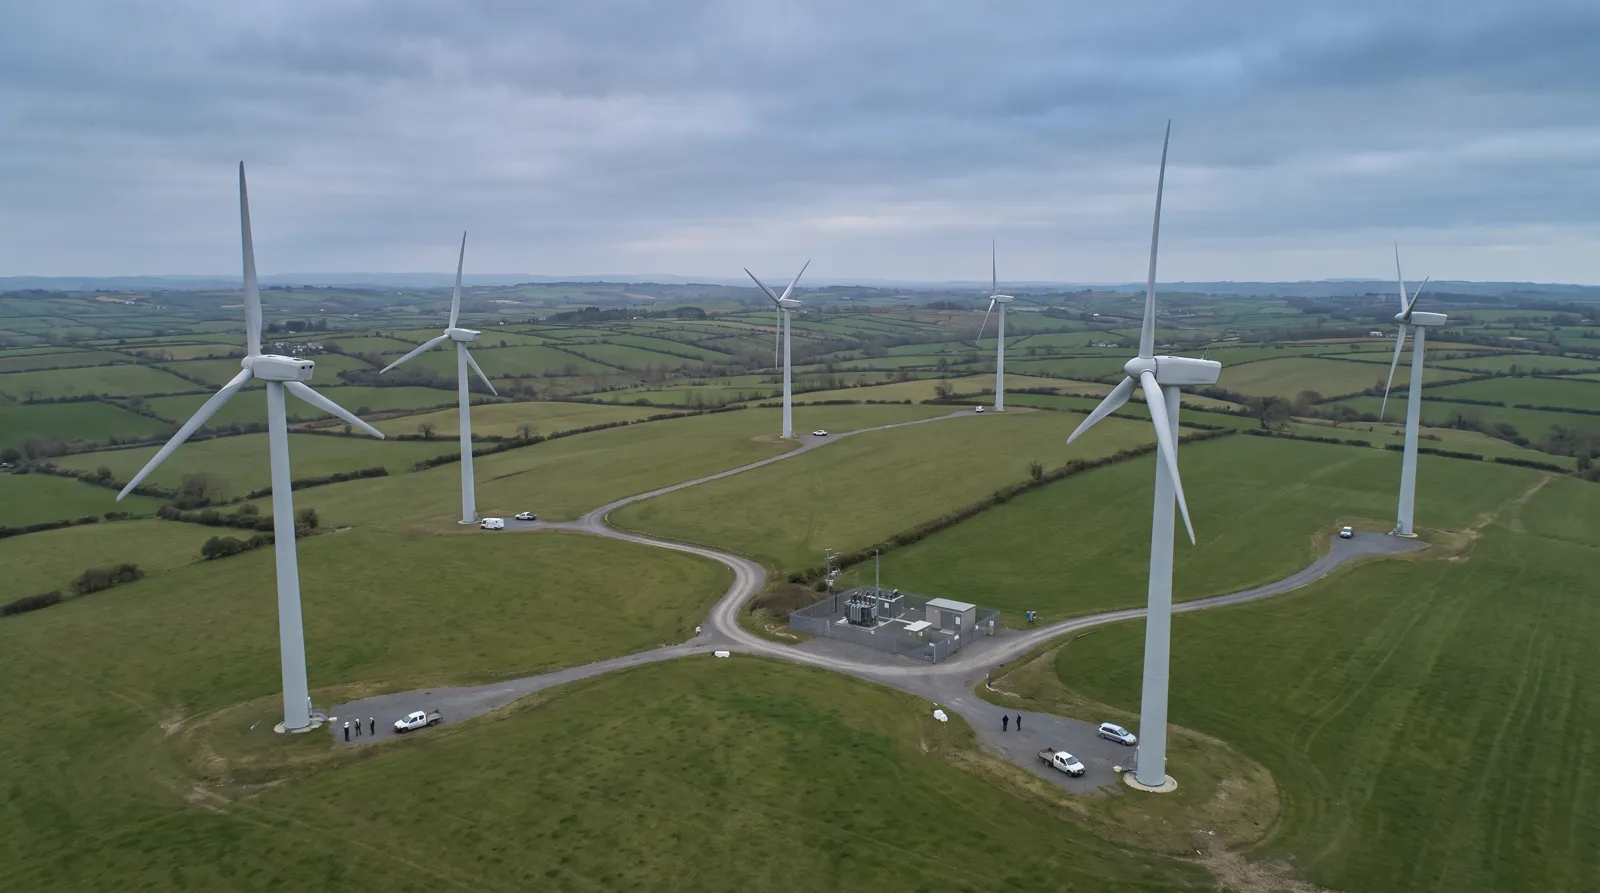
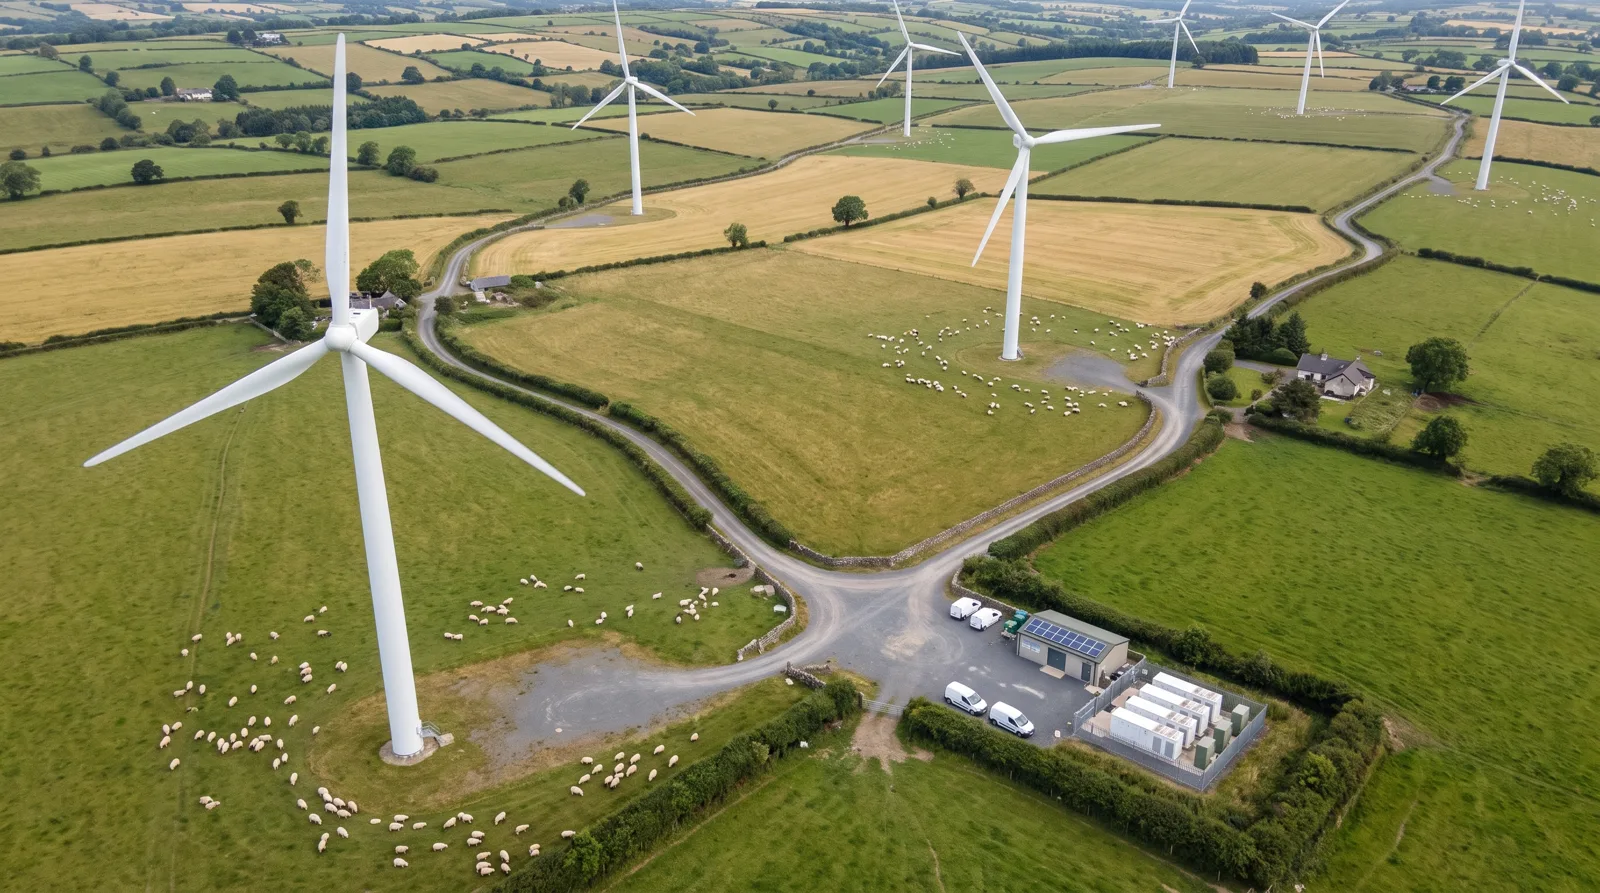
Photomontages from each viewpoint the town chose — porches, the school yard and the county road.
Monitoring doesn’t stop at the permit. These are 2025 counts from our operating farms; the accent share is when the turbines slowed or stopped because of them.