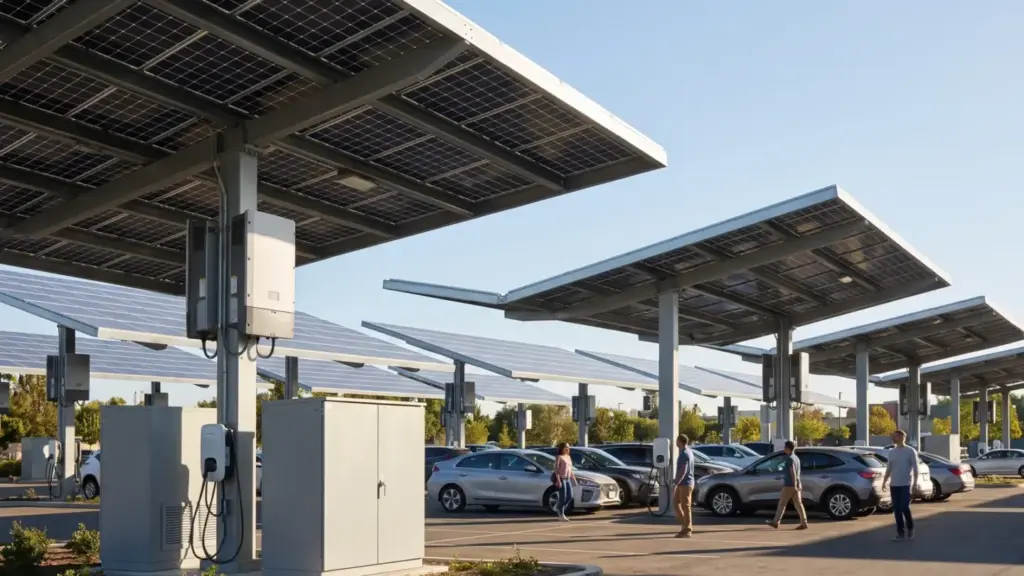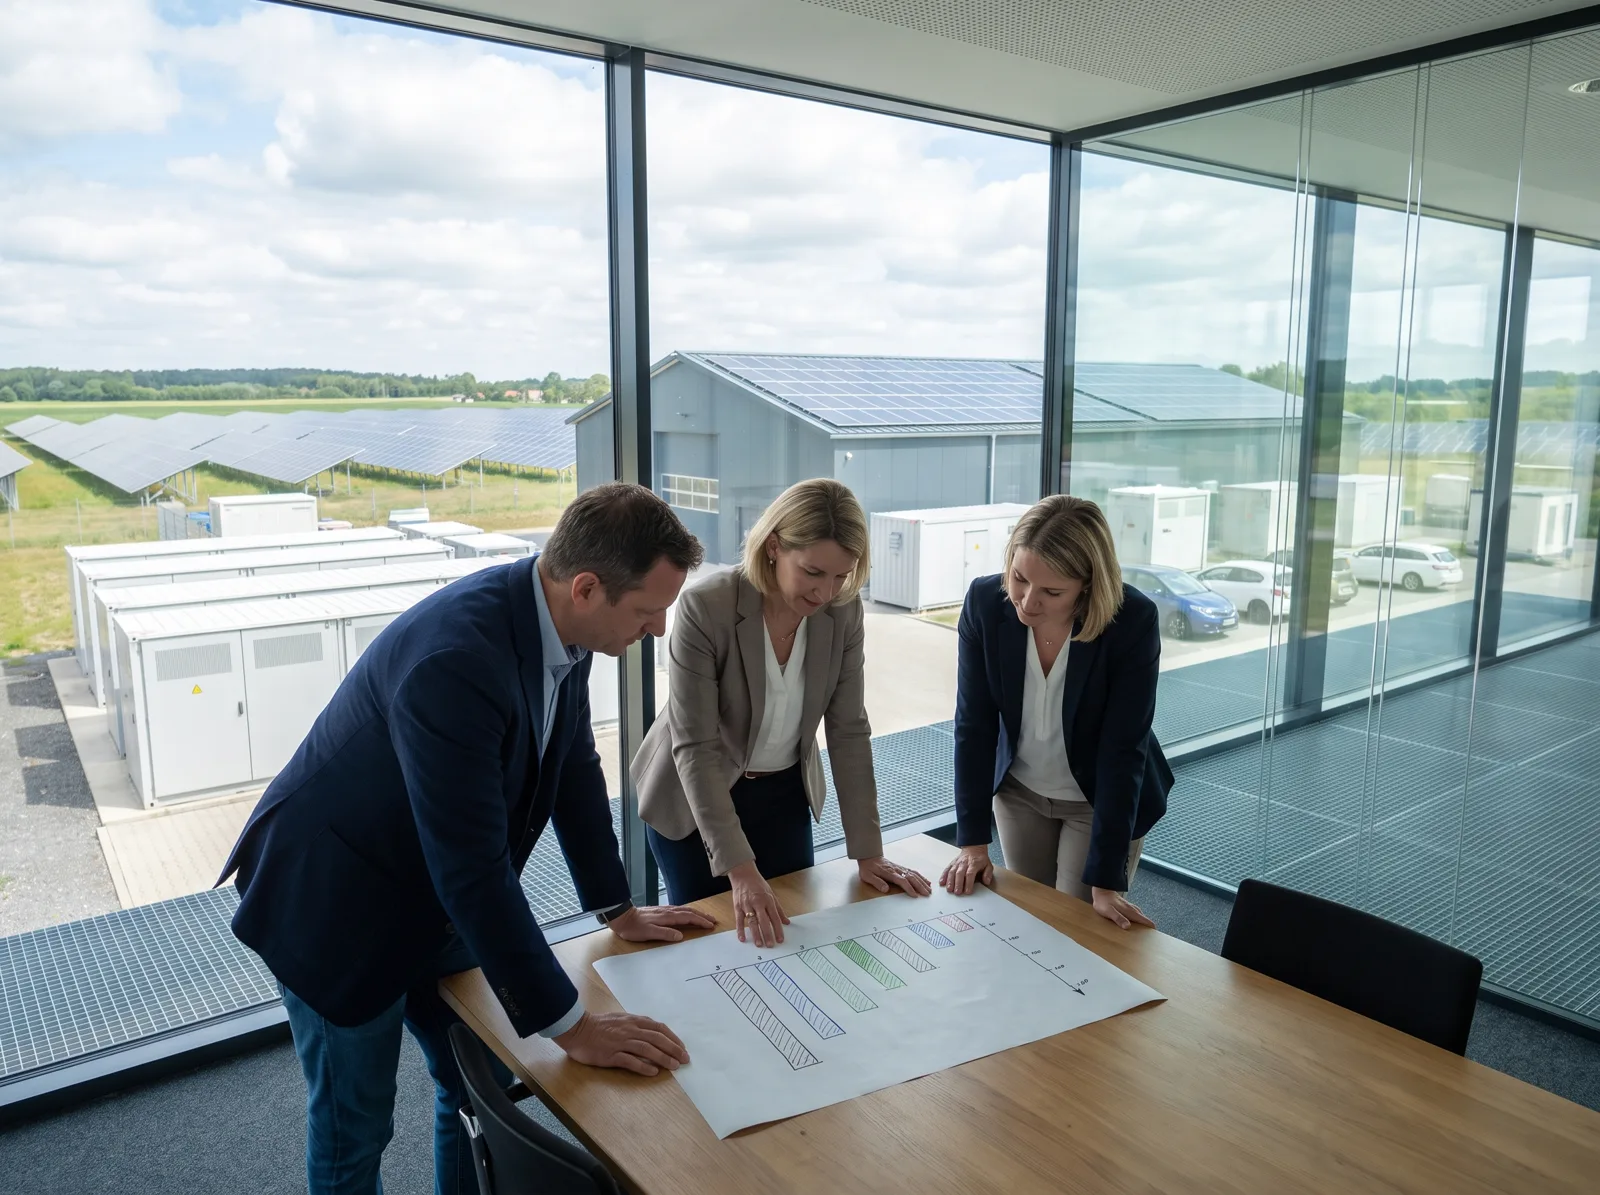
Every proposal we send prices the same plant three ways: a power purchase agreement, an operating lease and an outright purchase. The engineering does not change between the three columns. What changes is who owns the asset, who carries the risk and where the numbers land in your accounts.
The power purchase agreement
Under a PPA you pay nothing up front. We, or a fund on our lender panel, own and insure the system and sell you every kilowatt-hour it produces at a fixed rate — on most 2026 contracts between $0.064 and $0.078 per kWh, with an escalator of 0 to 2% a year. Operations and maintenance are included, and if the plant underperforms, the risk sits with the owner, not with you.
For a CFO the attraction is simple: the system never touches the balance sheet as an asset, and the saving appears from the first bill. The trade-off is that the owner keeps any incentives and most of the lifetime value.
The operating lease
A lease swaps the per-kWh price for a fixed monthly rent over seven to fifteen years. It suits sites where energy use is steady and the finance team prefers a predictable line in operating expenses. Production risk moves partly to you: a cloudy year still costs the same rent.
Owning the plant
Buying outright has the longest payback on paper and the best return over the system life. On a typical 1.2 MWp distribution centre, with an example 30% investment incentive, we model a simple payback of 4.7 years, a 25-year IRR of 19.2% and a levelised cost of $0.041 per kWh. Any incentives stay with you — they vary by location, and we model only what applies to your site — which is why this column usually wins when the business has capital to deploy.
How to read the comparison
- Look at year-one cash flow and 25-year value side by side, never one without the other
- Ask which assumptions are shared — tariff, degradation, availability — and check they are identical across the three columns
- Check who pays for inverter replacement in year 12 to 15
- Read the termination clause before the rate
The best model is the one your finance team can defend in a board meeting. That is why every Northbeam proposal shows all three, built from the same yield model and the same twelve months of interval data.