FLEET STATUS · 338 / 340 sites online · uptime 99.6% (2025)
Mon–Fri 7:00–18:00 CT     Careers     Client Portal
SALES DESK
+1-555-0188
HEAD OFFICE
1180 Meridian Pkwy, Ashford TX
FEASIBILITY
10-day desk study, no fee
Home / Projects
DOC NB-P12 · REV. 10/2026
[ Project register ]

340 sites built.
Every one metered.

Each project below lists what we installed, how it was paid for and how it has performed against the yield we promised. Filter by sector, or switch to the map.

410 MWp BUILT
14 STATES
LIVE O&M DATA
PROJECT FILE
NB-PR · 2026
410MWp
Commissioned since 2013 across rooftop, carport, ground-mount and storage.
SITES ENERGISED
340+
UNDER OUR O&M
296 sites
FLEET YIELD VS P50
101.6%
 
ON THIS PAGE
01   Featured project
02   All projects
03   Map view
04   Fleet data
02 / All projects

Filed by sector, specified to the module.

Every card carries the same facts — capacity, sector and the system we built, with its yield against P50 — so sites compare at a glance.
GRID
MAP
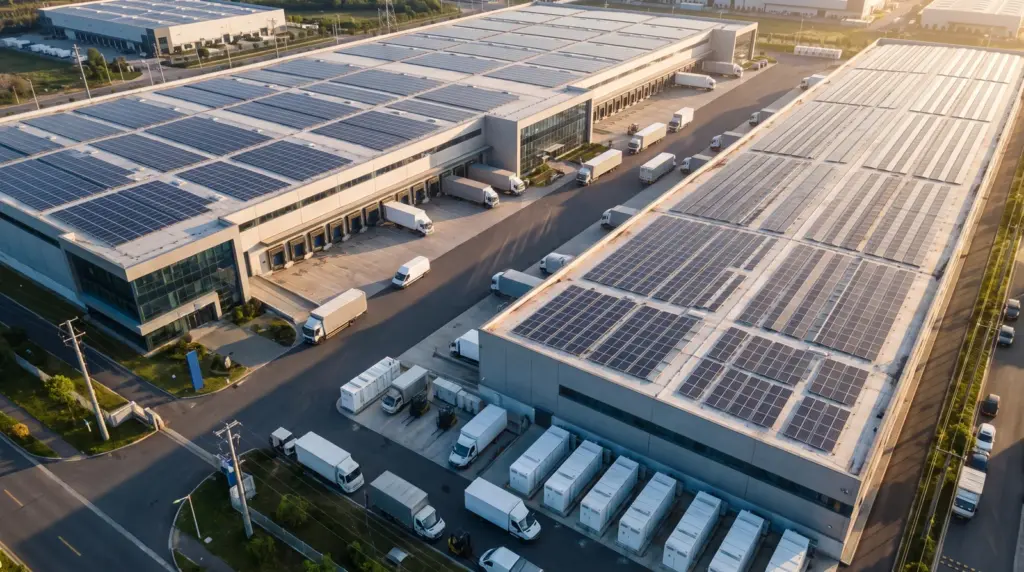
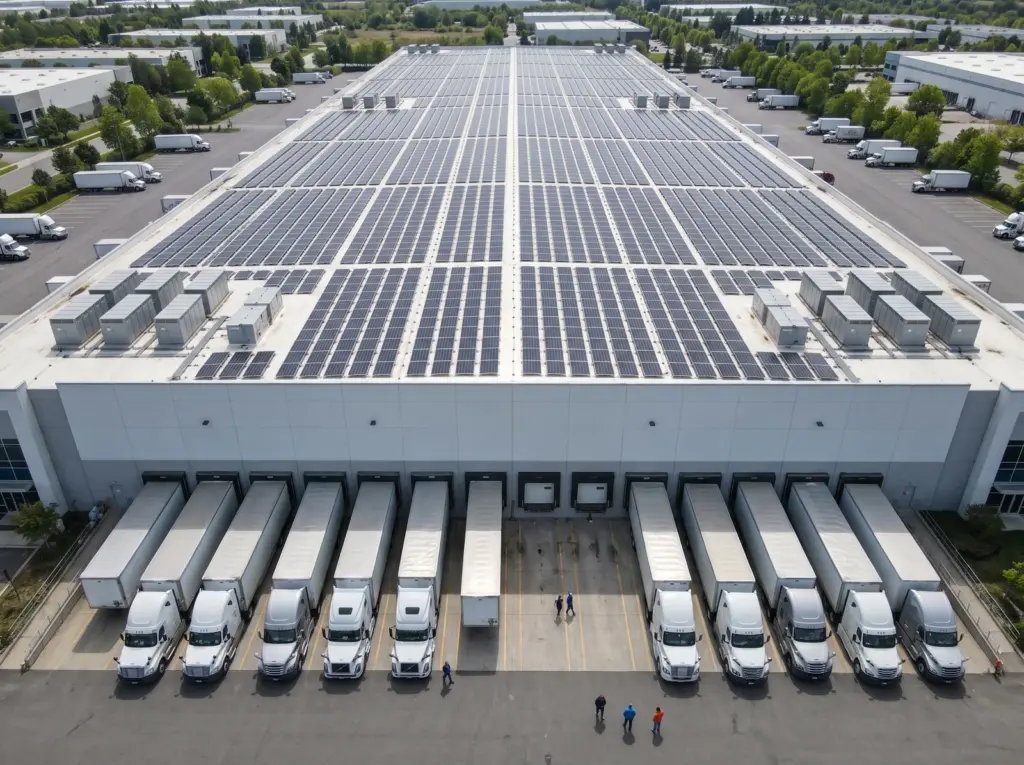
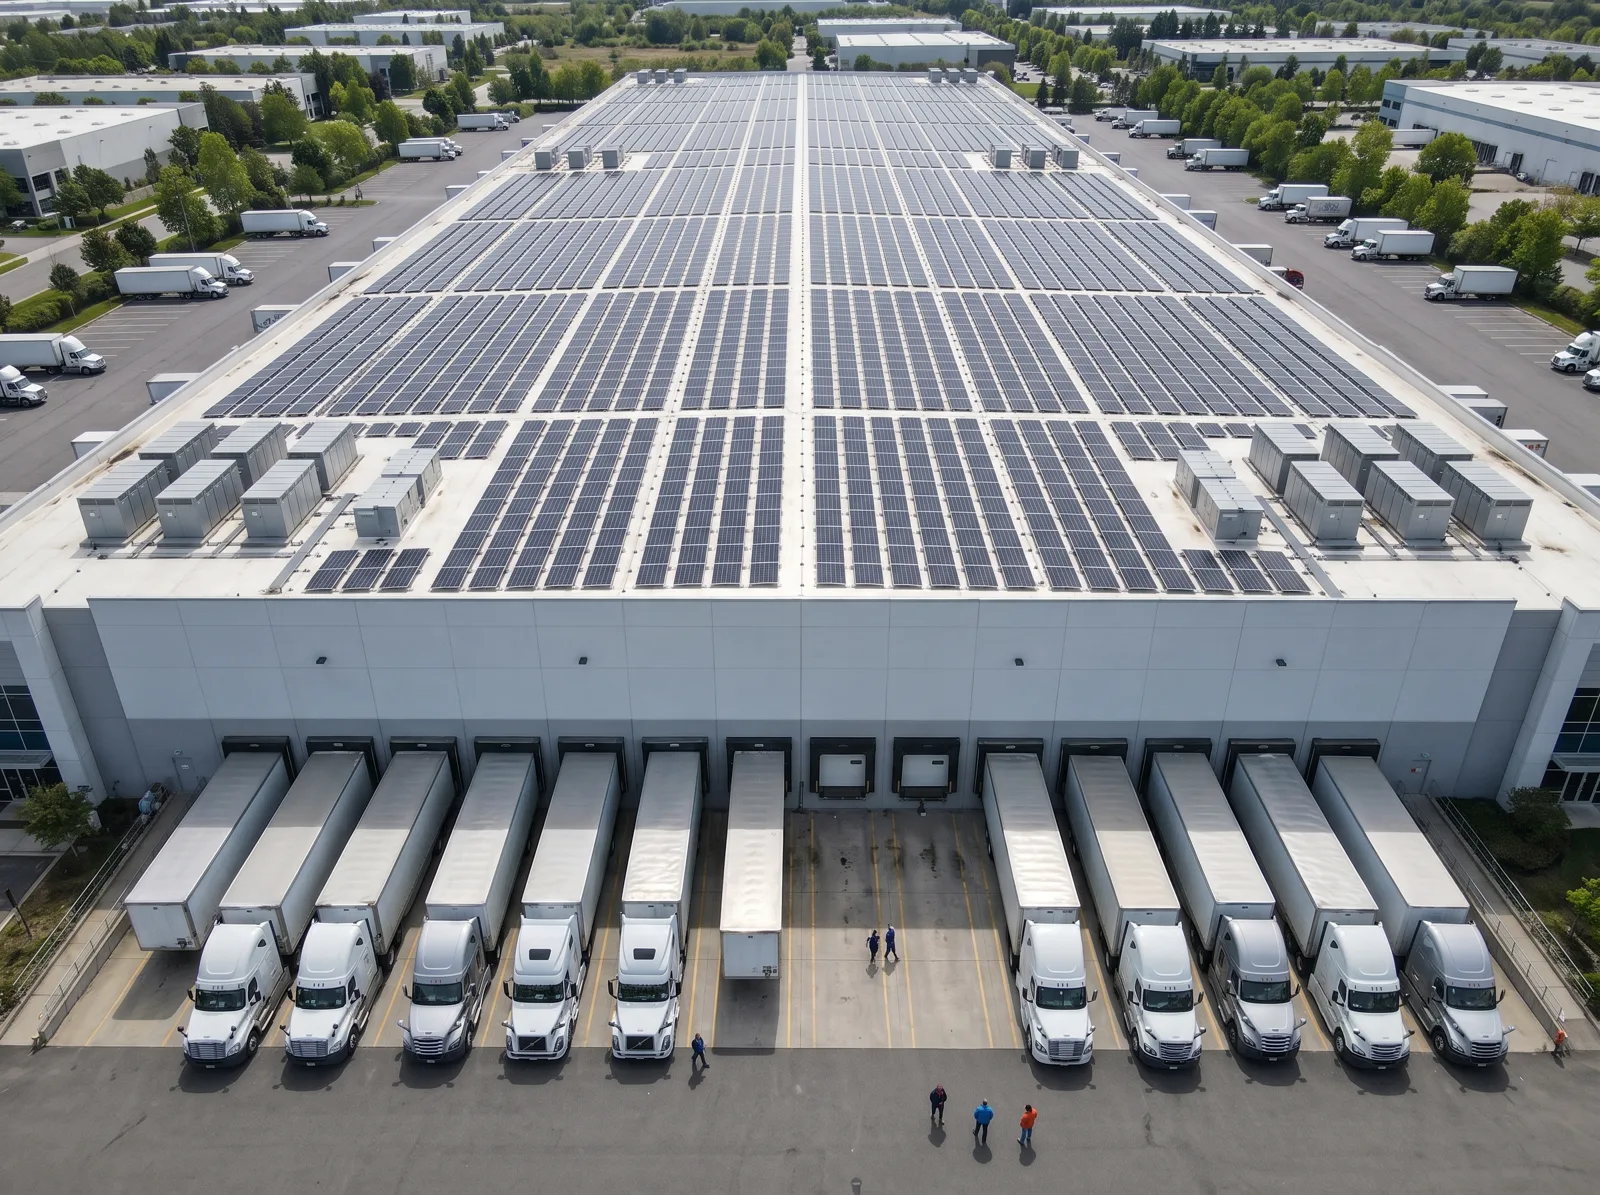
Distribution centre roof covered in solar modules above parked trucks

Harbor Logistics

Rooftop + storage · 1,742 MWh/yr · grid spend −31%
1.2 MWp
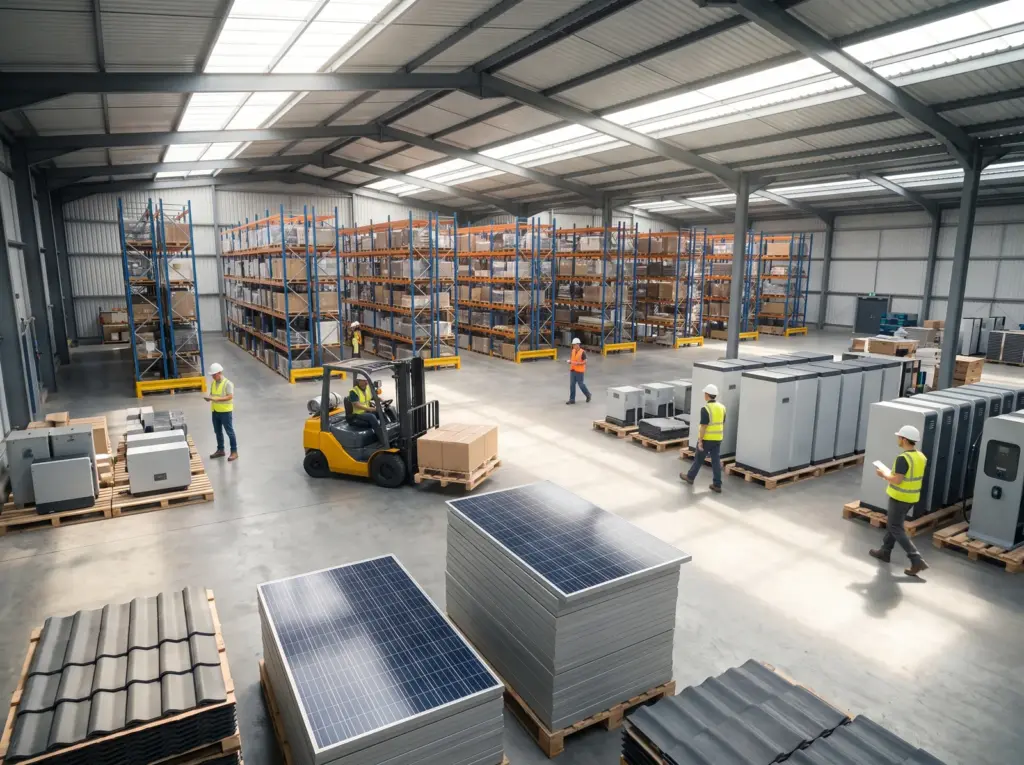
Warehouse interior with racking, a forklift and pallets of solar modules

Tamsin Cold Chain

Rooftop · TPO · in build, week 21 of 26
1.6 MWp
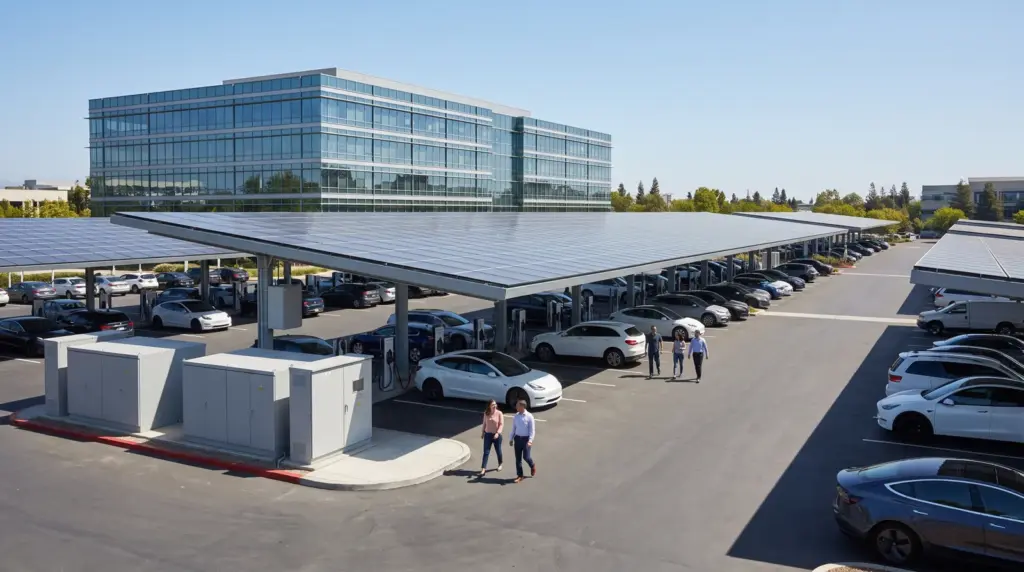
Solar carport canopies over a staff car park with EV chargers

Ashford Civic Solar Canopy

Carport · 64 bays · 101.2% of P50
310 kWp
Aerial view of a logistics warehouse with a rooftop solar array and loading docks

Kestrel Foods Packhouse

Rooftop + 1 MWh storage · 103.4% of P50
640 kWp
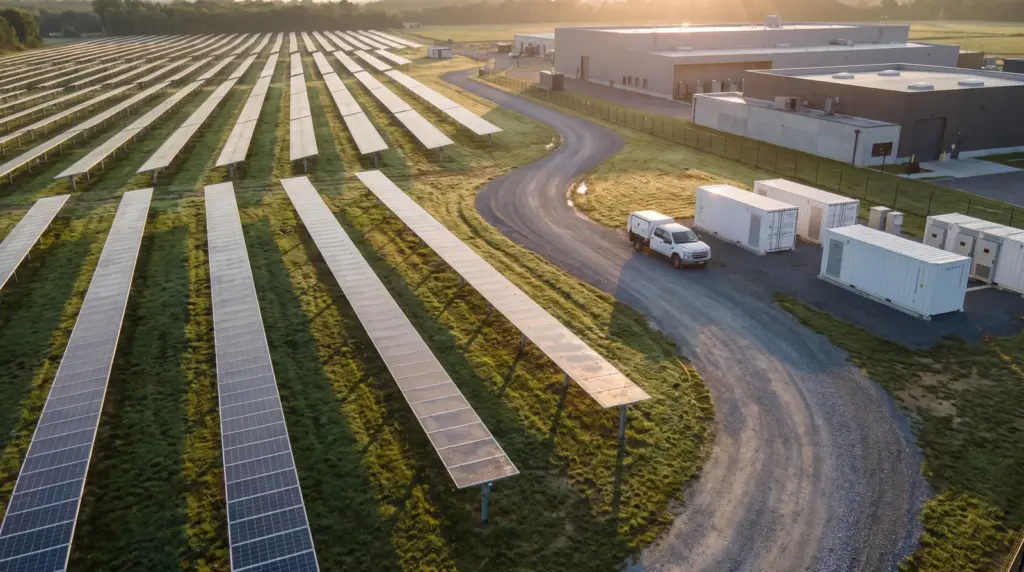
Ground-mounted solar rows beside a gravel service road

Teller Precision Plant

Ground-mount · single-axis · 100.9% of P50
1.6 MWp
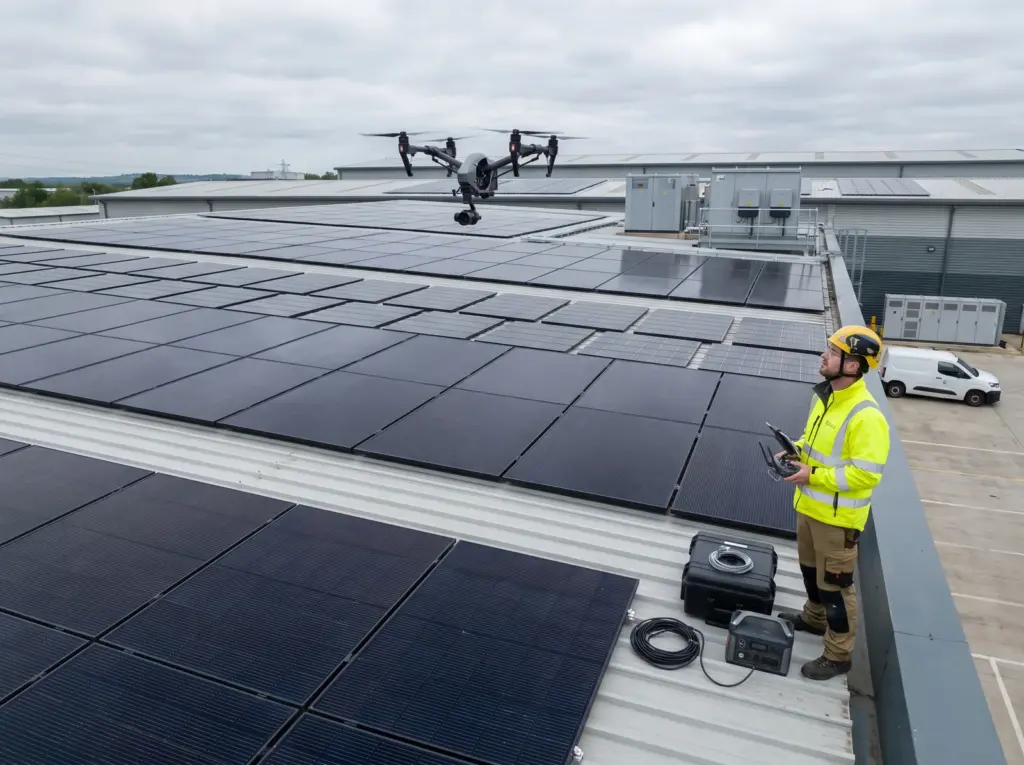
Technician flying an inspection drone over a rooftop solar array

Orbis Medical Campus

Rooftop + 2 MWh storage · 6 buildings
2.1 MWp
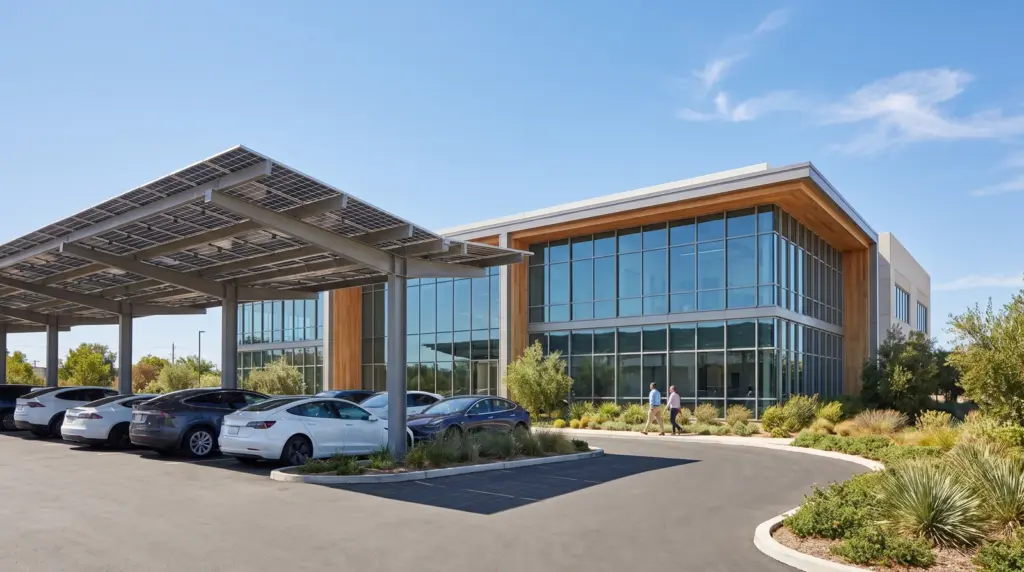
Northbeam head office building in Ashford

Caldwell Community College

Rooftop + carport · 101.8% of P50
740 kWp
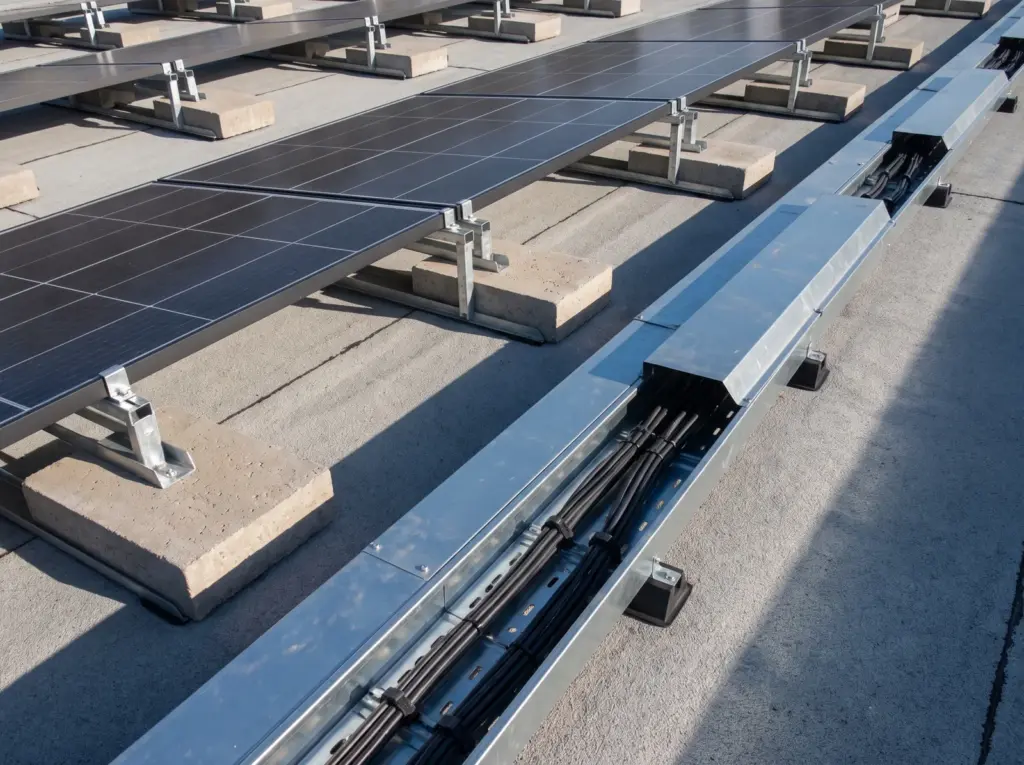
Close-up of solar module rails and clamps on a membrane roof

Monoline Retail Park

Rooftop + carport · 100.7% of P50
880 kWp
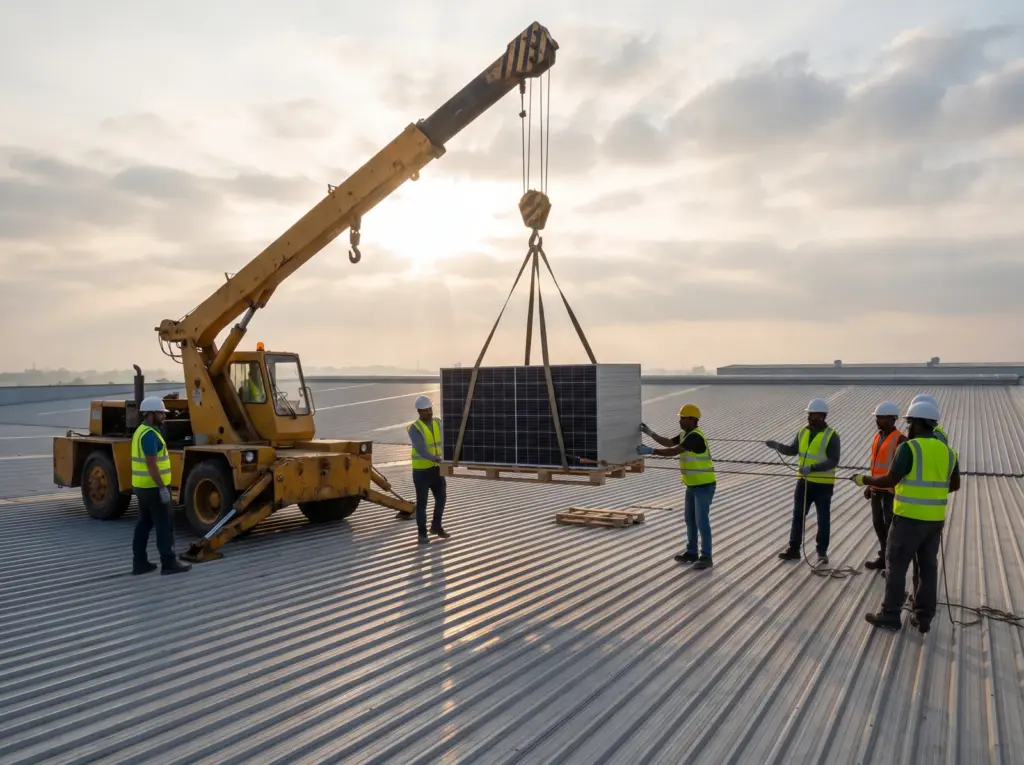
Installation crew mounting solar modules on a commercial roof

Brightline Distribution

Rooftop · standing seam + 400 kWh storage
520 kWp
10 CASE STUDIES ON FILE · 340 SITES ON THE REGISTER
03 / Map view

Clustered around three offices.

We only build where a crew can reach the site within four hours, so every project sits within range of Ashford, Denver or the Atlanta depot.


148
TX
34
OK
46
CO
27
AZ
39
GA
11
NM
9
TN
14
NC
PROJECT MAP · SCHEMATIC
OFFICE STATE
SITES
SITES BY STATE
OCT 2026
STATE
SITES
CAPACITY
Texas
148
176 MWp
Colorado
46
61 MWp
Georgia
39
52 MWp
Oklahoma
34
38 MWp
Arizona
27
36 MWp
Nine more states
46
47 MWp
Total
340
410 MWp
04 / Fleet data

Promised yield, delivered yield.

P50 is the yield we expect in an average year. We publish the gap across the whole fleet, not just the projects that look good.

410MWp
BUILT SINCE 2013
101.6%
FLEET YIELD VS P50
99.6%
FLEET UPTIME, 2025
296
SITES UNDER OUR O&M
YIELD VS P50 BY SECTOR · 2025
SCALE 90–105% · LINE = P50
Agri & food


103.0%
Logistics


102.4%
Campuses


101.9%
Manufacturing


101.1%
Retail


100.8%
Healthcare


100.2%
90%
95%
P50
105%
Weather-corrected, metered at the revenue meter. Sites energised before 2025 only.

Below P50? We say so — and fix it.

Four sites ran under P50 in 2025. Each one has a public root-cause note: two soiling events, one inverter fault, one shading change from a neighbour’s new building.
SITES UNDER P50
4 of 296
MEDIAN FIX TIME
9 days
MONITORING
15-min, 24 / 7
Next step / Feasibility study

Send 12 months of bills. Get three priced options in 10 working days.

NO FEE · NO OBLIGATION · AN ENGINEER REPLIES IN ONE WORKING DAY
DIRECT LINES
SALES DESK
+1-555-0188
O&M DESK
24 / 7 / 365