

FLEET STATUS · 338 / 340 sites online · uptime 99.6% (2025)
Mon–Fri 7:00–18:00 CT     Careers     Client Portal
SALES DESK
+1-555-0188
HEAD OFFICE
1180 Meridian Pkwy, Ashford TX
FEASIBILITY
10-day desk study, no fee
Home / Solutions
DOC NB-P02 · REV. 10/2026
[ Solutions ]

Five system types.
One engineering team.

Rooftop, carport, ground-mount, storage and O&M — each designed to your load tables and tariff by our own licensed engineers, then built and run by the same people for 25 years.

5 SYSTEM TYPES
250 kWp – 25 MWp
YIELD GUARANTEED
FLEET FILE
NB-SOL · 2026
410MWp
Installed across 340+ commercial sites in 14 states.
ROOFTOP
61% · 250 MWp
GROUND-MOUNT
22% · 90 MWp
CARPORT
17% · 70 MWp
 
ON THIS PAGE
01   System register
02   Pairings
03   Which fits your site
04   Delivery
01 / System register

Pick one system, or let your interval data pick the mix.

Each system is a standard we have built dozens of times, not a one-off. The spec column shows the ranges we design to — your feasibility study narrows them to a single number.
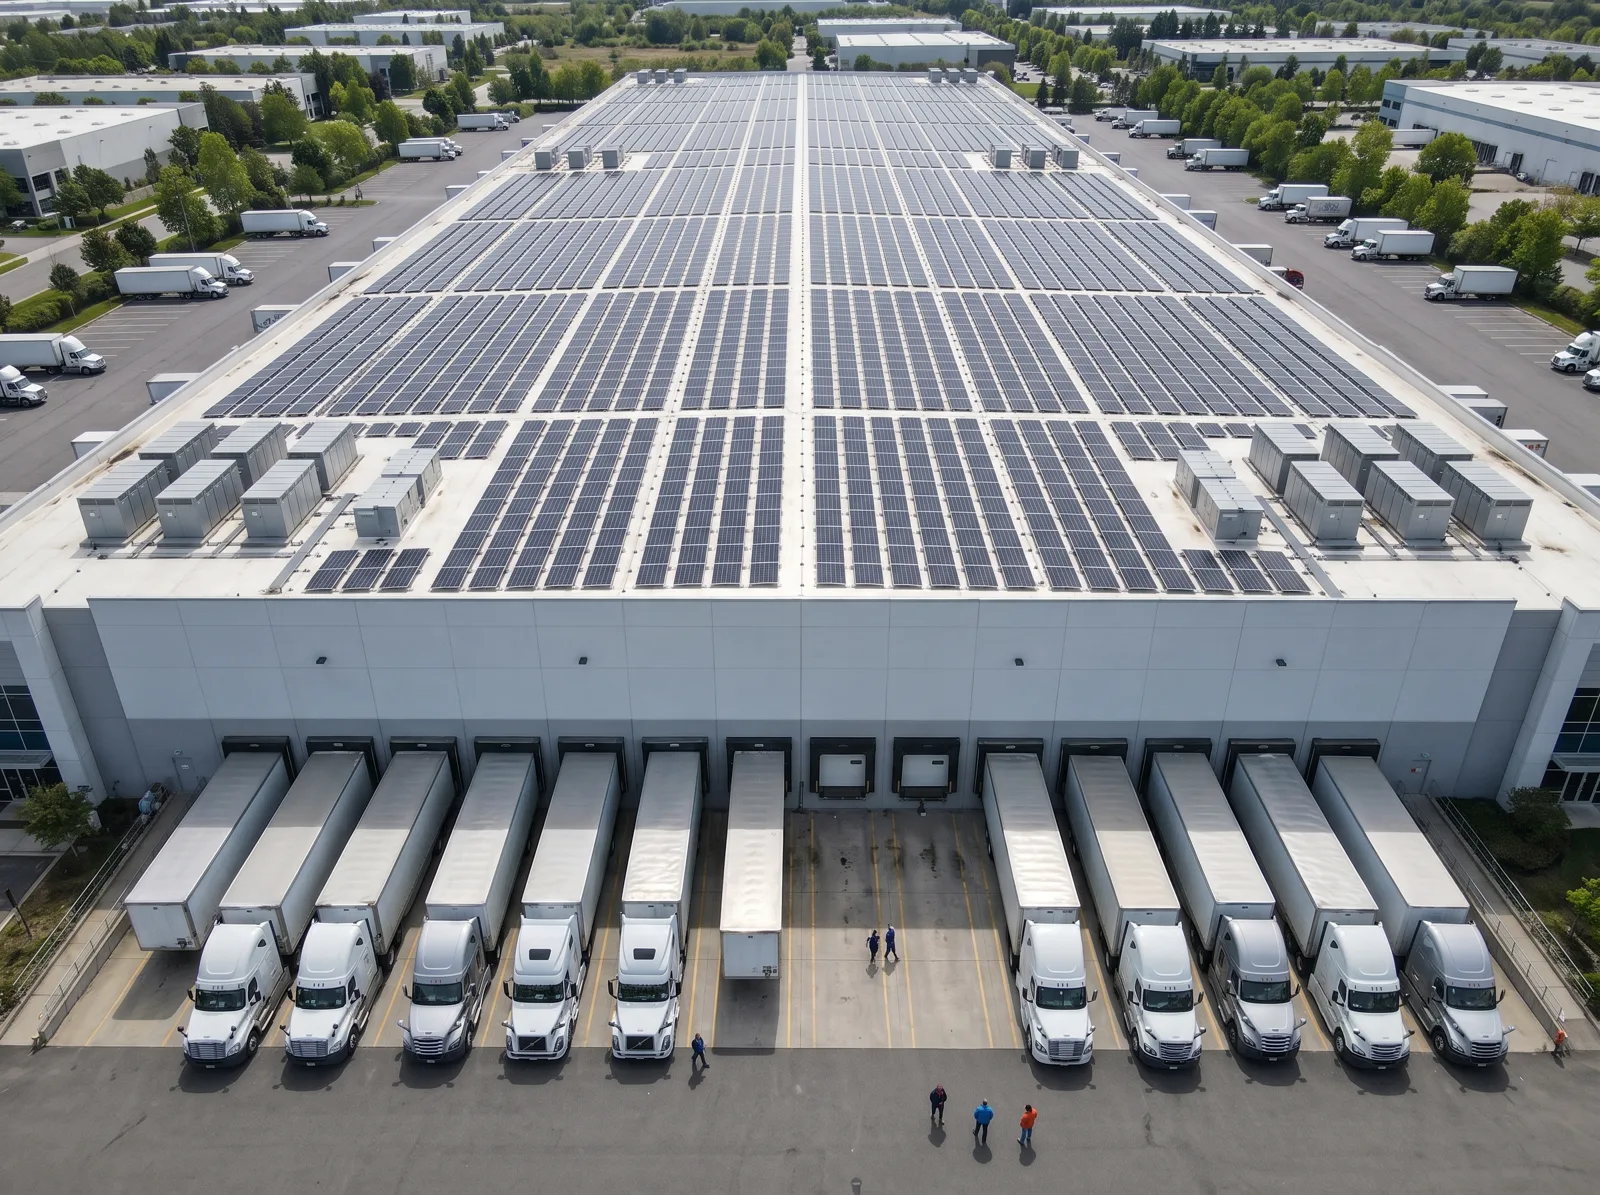
Distribution centre roof covered in solar modules above parked trucks
S-01
S-01 · ROOFTOP PV

Rooftop Arrays

Ballasted or rail-mounted on metal, TPO and concrete decks, laid out around skylights, HVAC and fire setbacks. Every roof gets a structural check before a layout is drawn.
Logistics
Manufacturing
Retail
SPEC
RANGE
250 kWp – 6 MWp
SPECIFIC YIELD
1,380–1,520 kWh/kWp
ADDED LOAD
12–22 kg/m²
TYPICAL PAYBACK
4–6 years
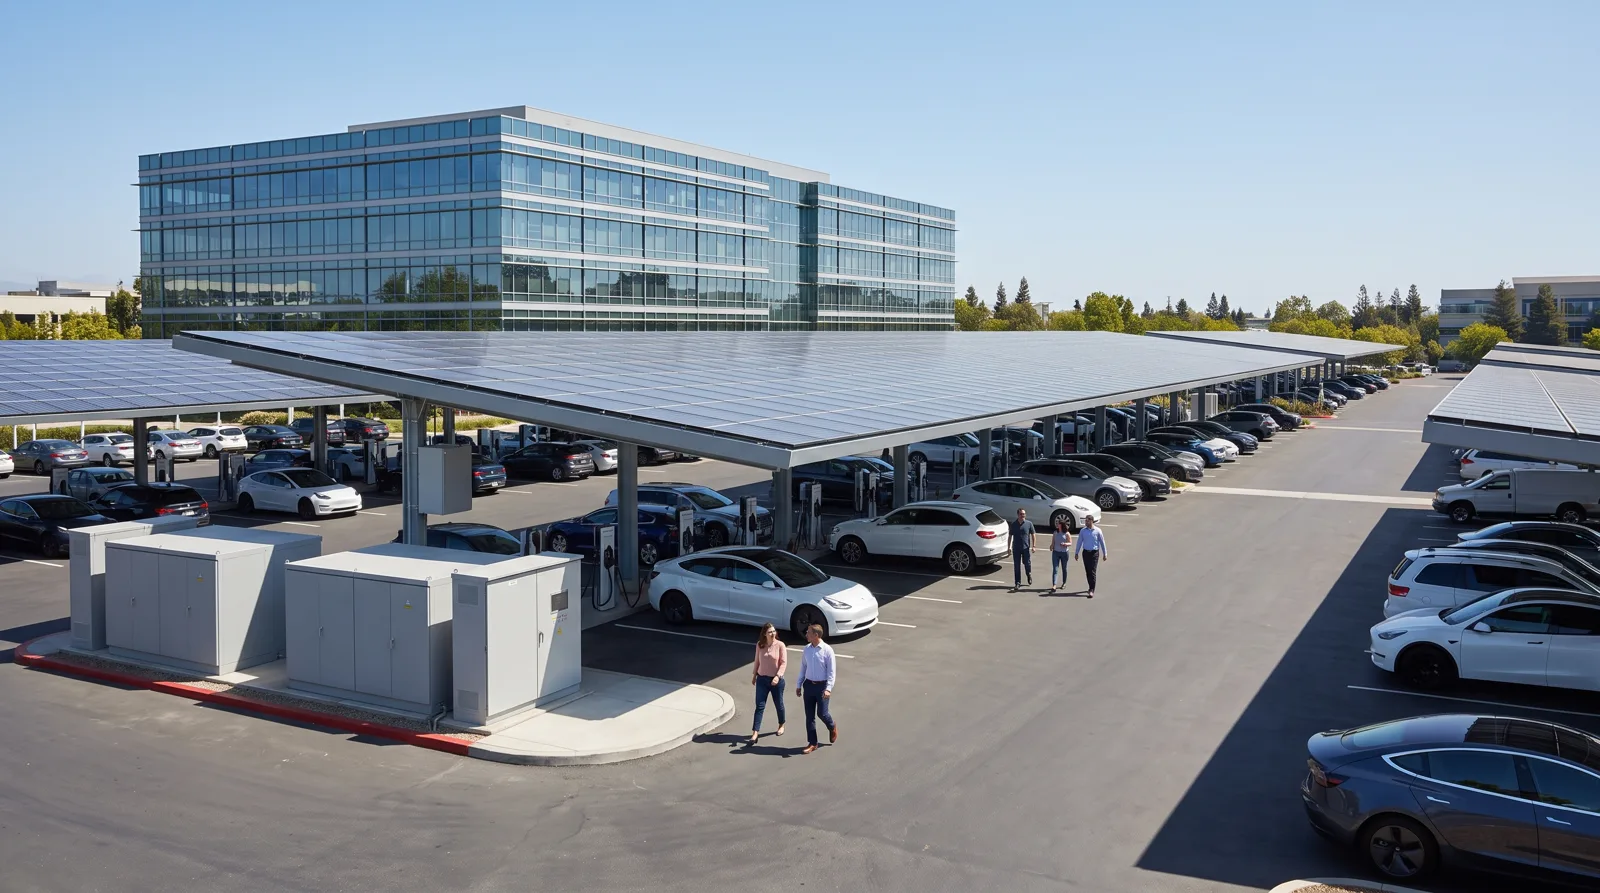
Solar carport canopies over a staff car park with EV chargers
S-02
S-02 · CARPORT

Solar Carports

Galvanised steel canopies that shade staff parking and feed EV chargers below — single or double cantilever, engineered for 140 mph wind and drained to your storm system.
Campuses
Healthcare
Retail parks
SPEC
BAYS
40 – 900
WIND RATING
140 mph
CHARGING
Level 2 + DC fast
TYPICAL PAYBACK
6–8 years
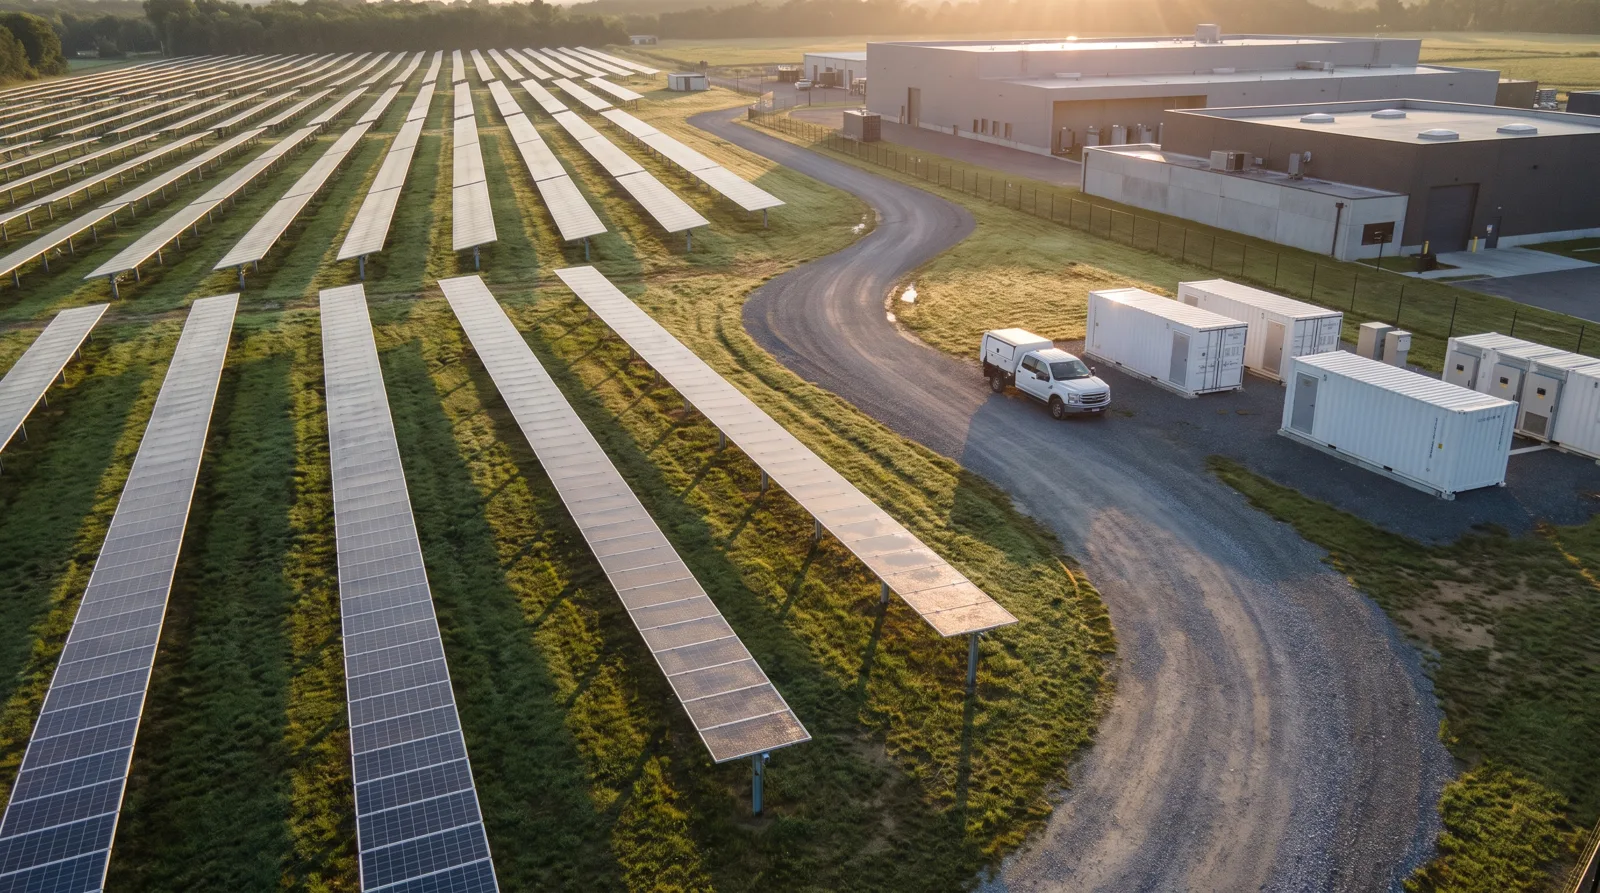
Ground-mounted solar rows beside a gravel service road
S-03
S-03 · GROUND-MOUNT

Ground-Mount Fields

Fixed-tilt or single-axis tracker fields on spare land next to your plant, connected behind the meter at medium voltage or exported under a utility agreement.
Plants
Agri & food
Water utilities
SPEC
RANGE
1 – 25 MWp
TRACKER GAIN
+18% yield
LAND
≈ 1.6 ha per MWp
CONNECTION
Medium voltage
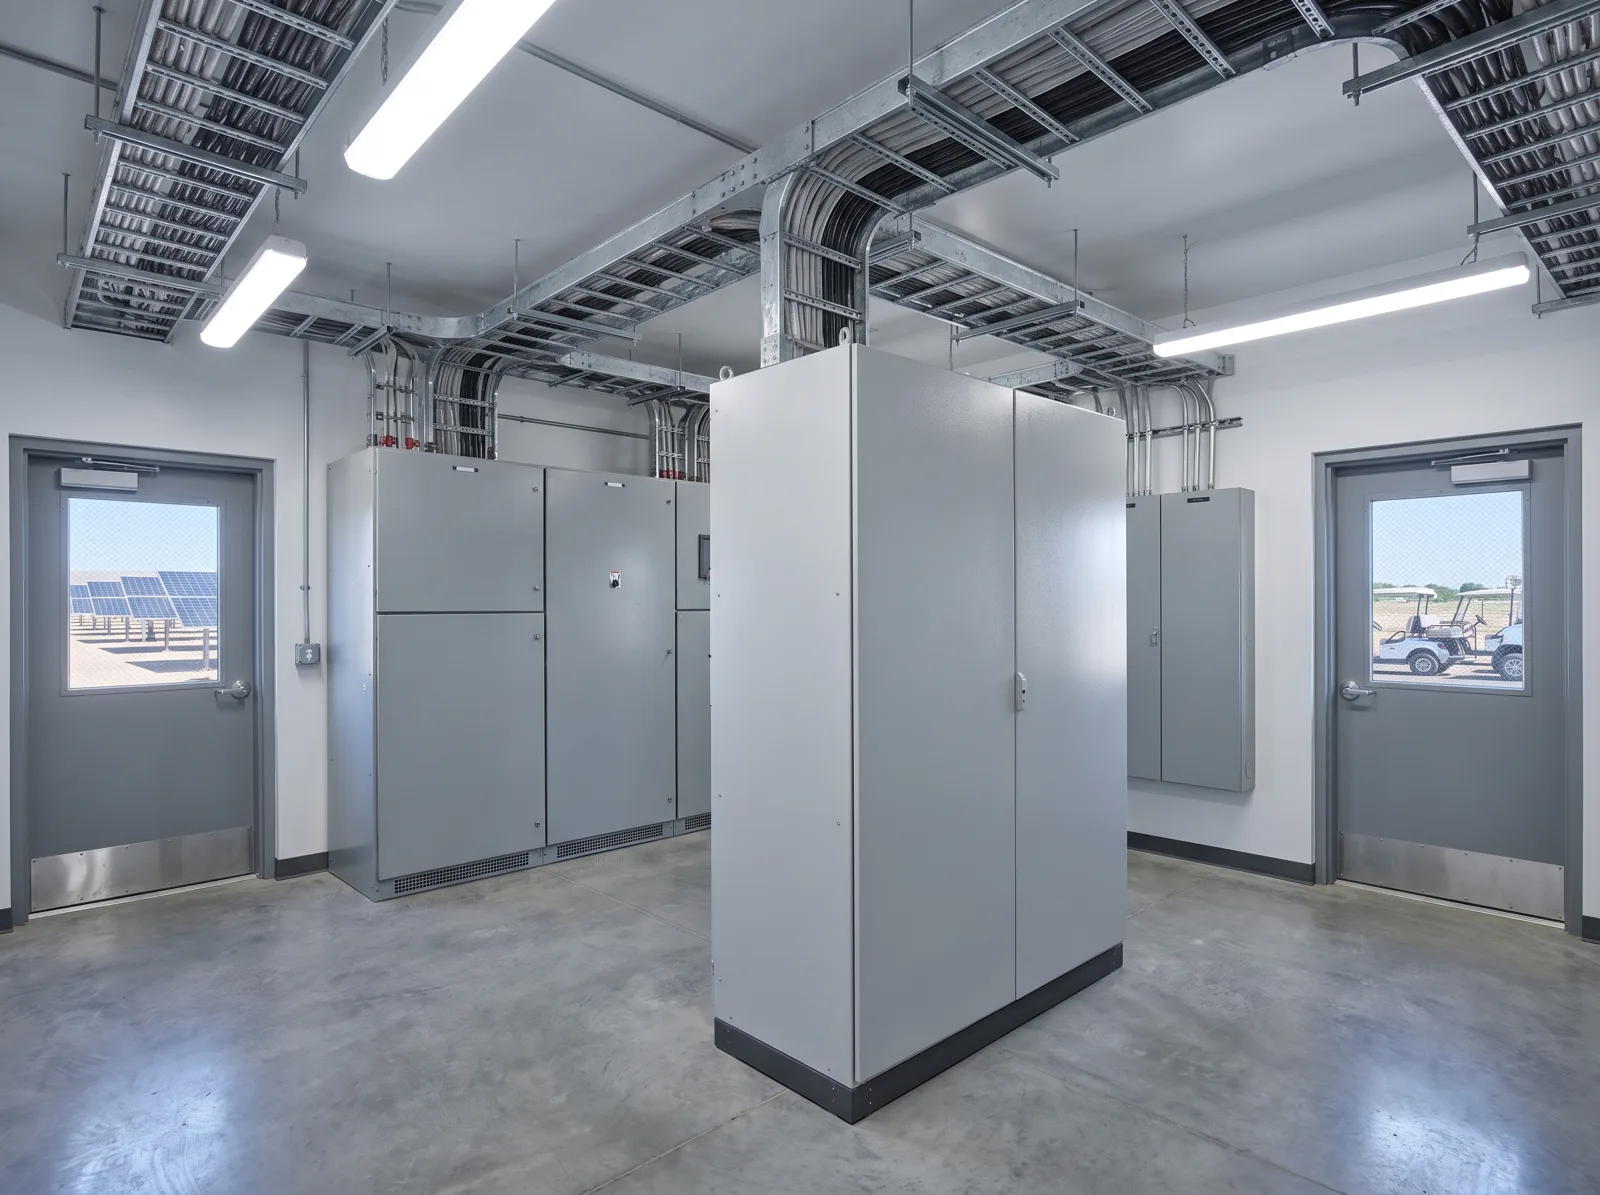
Battery storage cabinets in a clean electrical room
S-04
S-04 · STORAGE

Battery Storage

LFP battery systems that clip demand charges, shift midday solar into the evening peak and keep critical lines running through grid outages.
Cold chain
Data rooms
Healthcare
SPEC
CAPACITY
250 kWh – 20 MWh
PEAK CUT
up to 38%
BACKUP
2–4 h critical load
CHEMISTRY
LFP · UL 9540
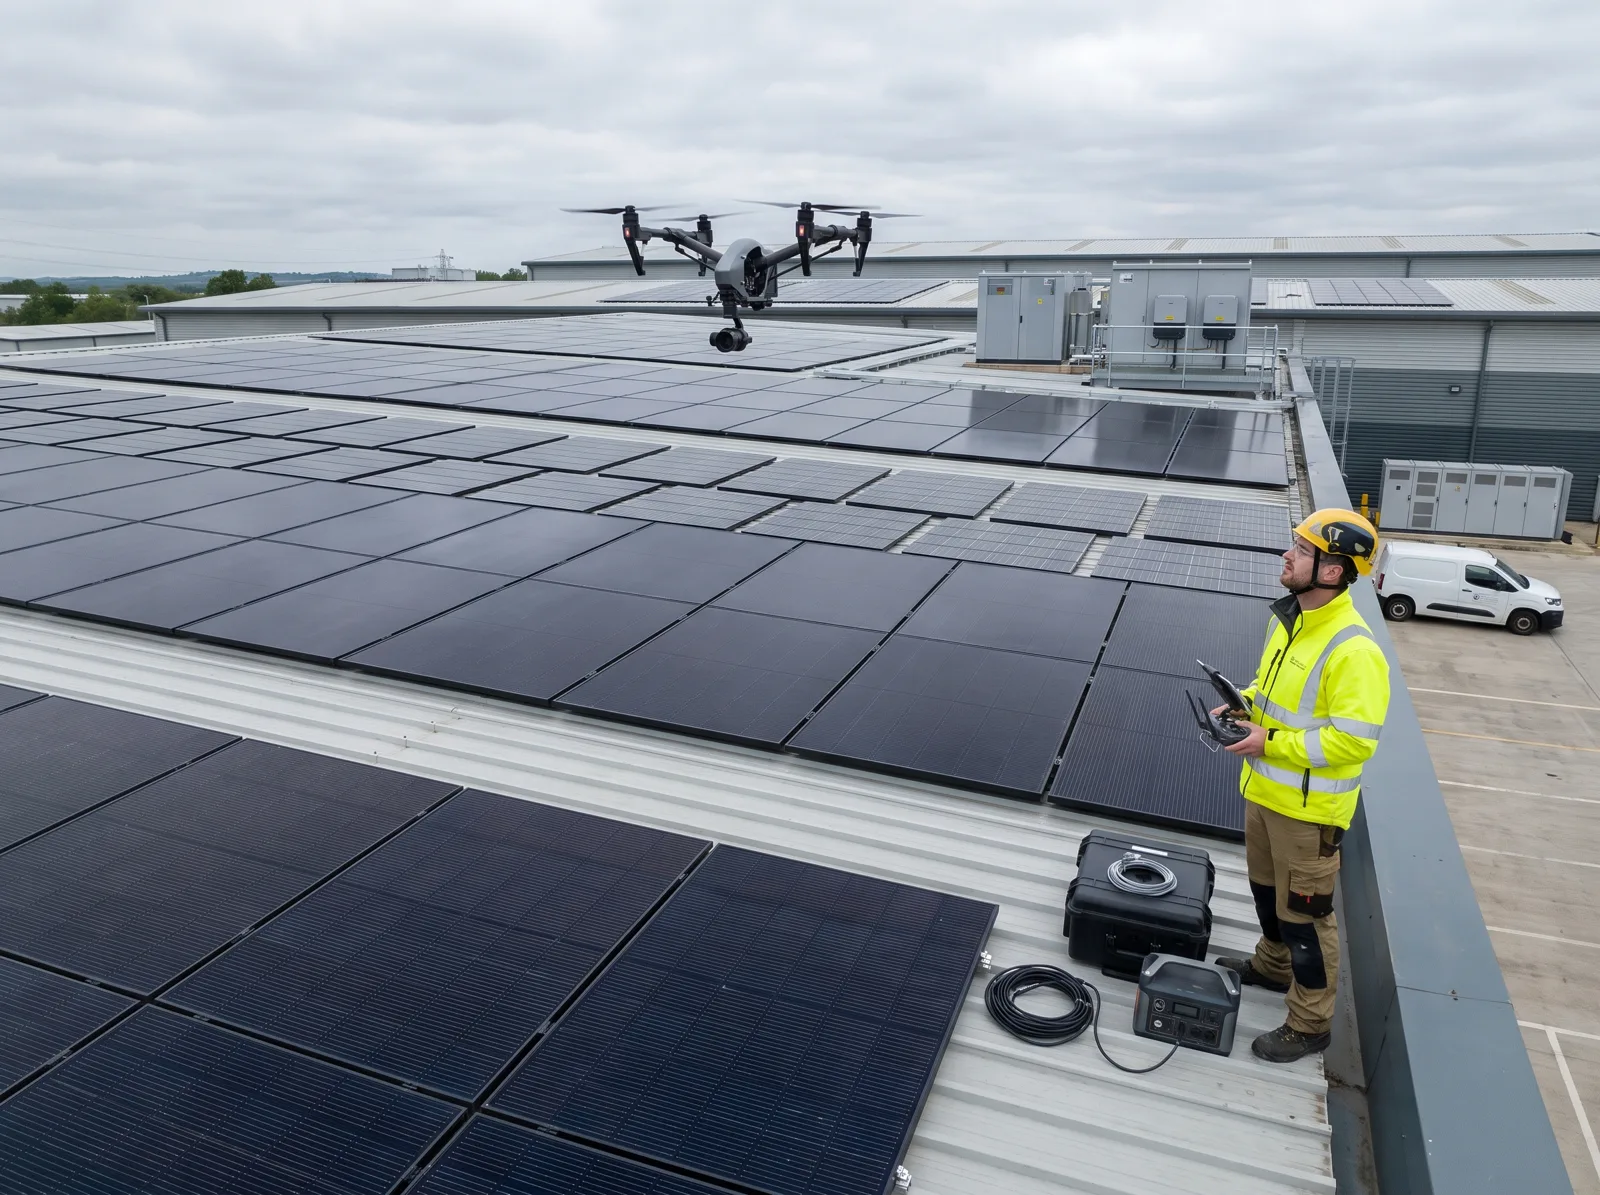
Technician flying an inspection drone over a rooftop solar array
S-05
S-05 · O&M + DRONE

Operations & Maintenance

Monitoring, thermal drone surveys and field repairs for every site in the fleet — including systems we did not build. Reported monthly, string by string.

Any system
Inherited fleets
Portfolios
SPEC
FAULT SLA
< 4 h on site
FLEET UPTIME
99.6% in 2025
THERMAL SURVEY
Every 6 months
REPORTING
Monthly, per string
02 / Pairings

Most sites end up with two systems, not one.

Six in ten of our 2025 projects combined generation with storage or charging. These are the three pairings we model most often — with the results they actually delivered.

PAIRING P-A
TYPICAL RESULT

Rooftop + Storage

Shift midday surplus into the evening peak and clip the demand charges that make up a third of most C&I bills.

SELF-CONSUMPTION
DEMAND CHARGE
91%
−34%
REF · HARBOR LOGISTICS, TX
PAIRING P-B
TYPICAL RESULT

Carport + EV Charging

Shade staff and fleet parking and charge vans straight from the canopy, with a battery buffer for DC fast chargers.

FLEET kWh FROM SOLAR
BAYS COVERED
62%
64
REF · ASHFORD CIVIC CANOPY
PAIRING P-C
TYPICAL RESULT

Ground-Mount + Storage

For plants and campuses with spare land but crowded roofs — a tracker field sized to the whole site load.

SITE LOAD COVERED
TRACKER GAIN
72%
+18%
REF · ORBIS MEDICAL CAMPUS
03 / Which fits your site

Four questions decide the system before we ever price it.

Roof condition, parking, land and the shape of your load. Use the table as a first filter — the feasibility study replaces every range with a number for your site.

SWIPE TABLE
CRITERION
S-01
Rooftop
S-02
Carport
S-03
Ground-mount
S-04
Storage
YOU NEED
Sound roof, 10+ yrs life left
Open parking, 40+ bays
Spare land, ≈ 1.6 ha / MWp
Demand charges or outage risk
TYPICAL SIZE
400 kWp – 2 MWp
150 – 900 kWp
2 – 12 MWp
500 kWh – 4 MWh
ON-SITE BUILD
4 – 10 weeks
8 – 14 weeks
12 – 24 weeks
3 – 6 weeks
INDICATIVE COST
$0.95 – 1.20 / Wp
$1.60 – 2.10 / Wp
$0.85 – 1.05 / Wp
$380 – 520 / kWh
PERMITTING
Building permit
Building + zoning
Land use + grid study
Fire code review
BEST FOR
Big flat roofs, daytime load
Visible commitment, EV fleets
Whole-site coverage
Peaky or critical loads
INDICATIVE 2026 RANGES · BEFORE INCENTIVES · EXCLUDES GRID UPGRADES
04 / Delivery

Every system follows the same five phases.

01
W0 – W2
Feasibility
02
W2 – W8
Design
03
W6 – W18
Permits
04
W18 – W24
Build
05
Year 1 – 25
Operate
Next step / Feasibility study

Send 12 months of bills. Get three priced options in 10 working days.

NO FEE · NO OBLIGATION · AN ENGINEER REPLIES IN ONE WORKING DAY
DIRECT LINES
SALES DESK
+1-555-0188
O&M DESK
24 / 7 / 365