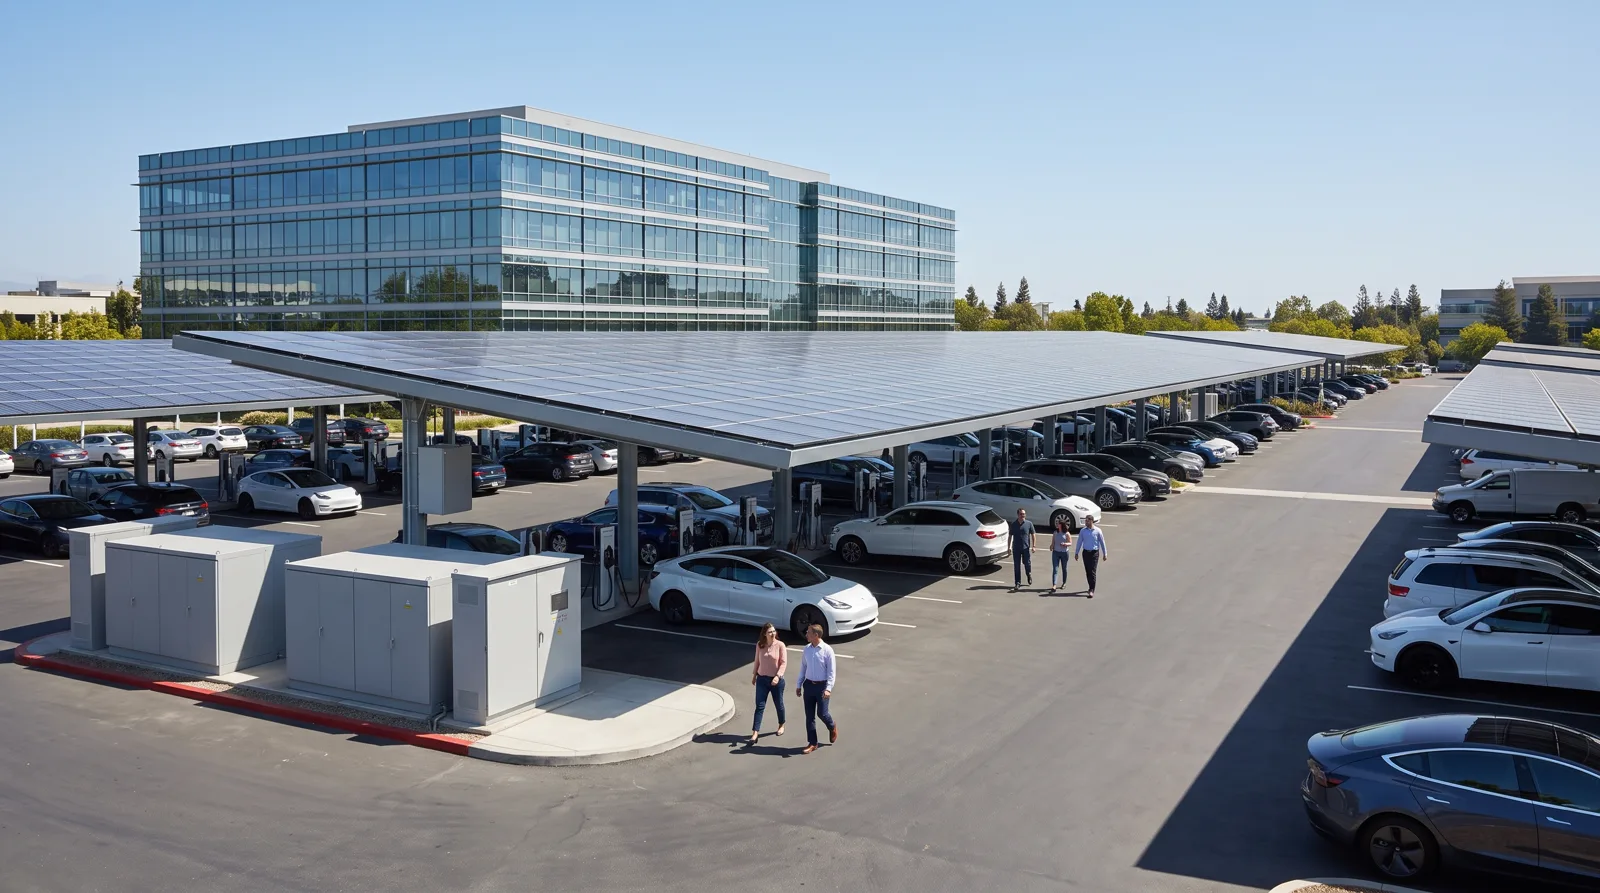
A cold store, a two-shift plant and a hospital draw power in completely different shapes. We size every plant from 12 months of interval data — this is what that data usually looks like.
Ranges and paybacks below are medians from our own asset register, owner-funded and before incentives. Your feasibility study replaces them with your site’s numbers.
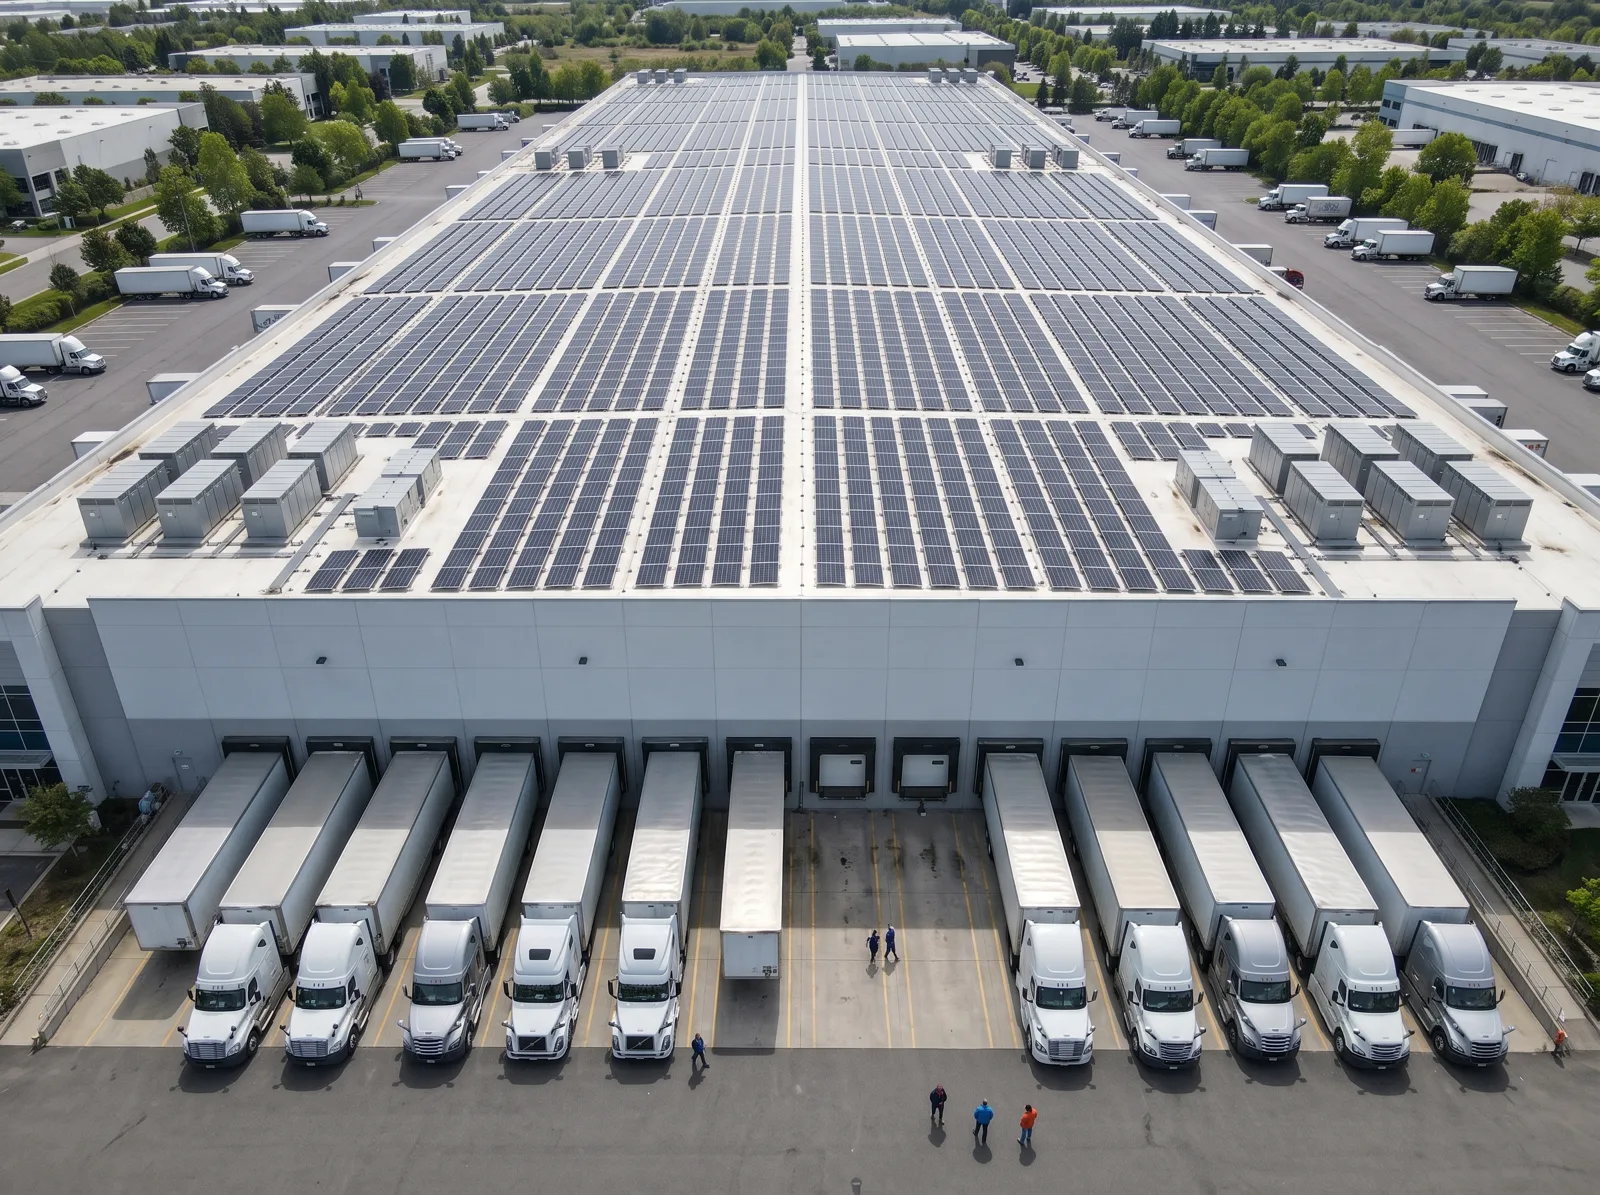
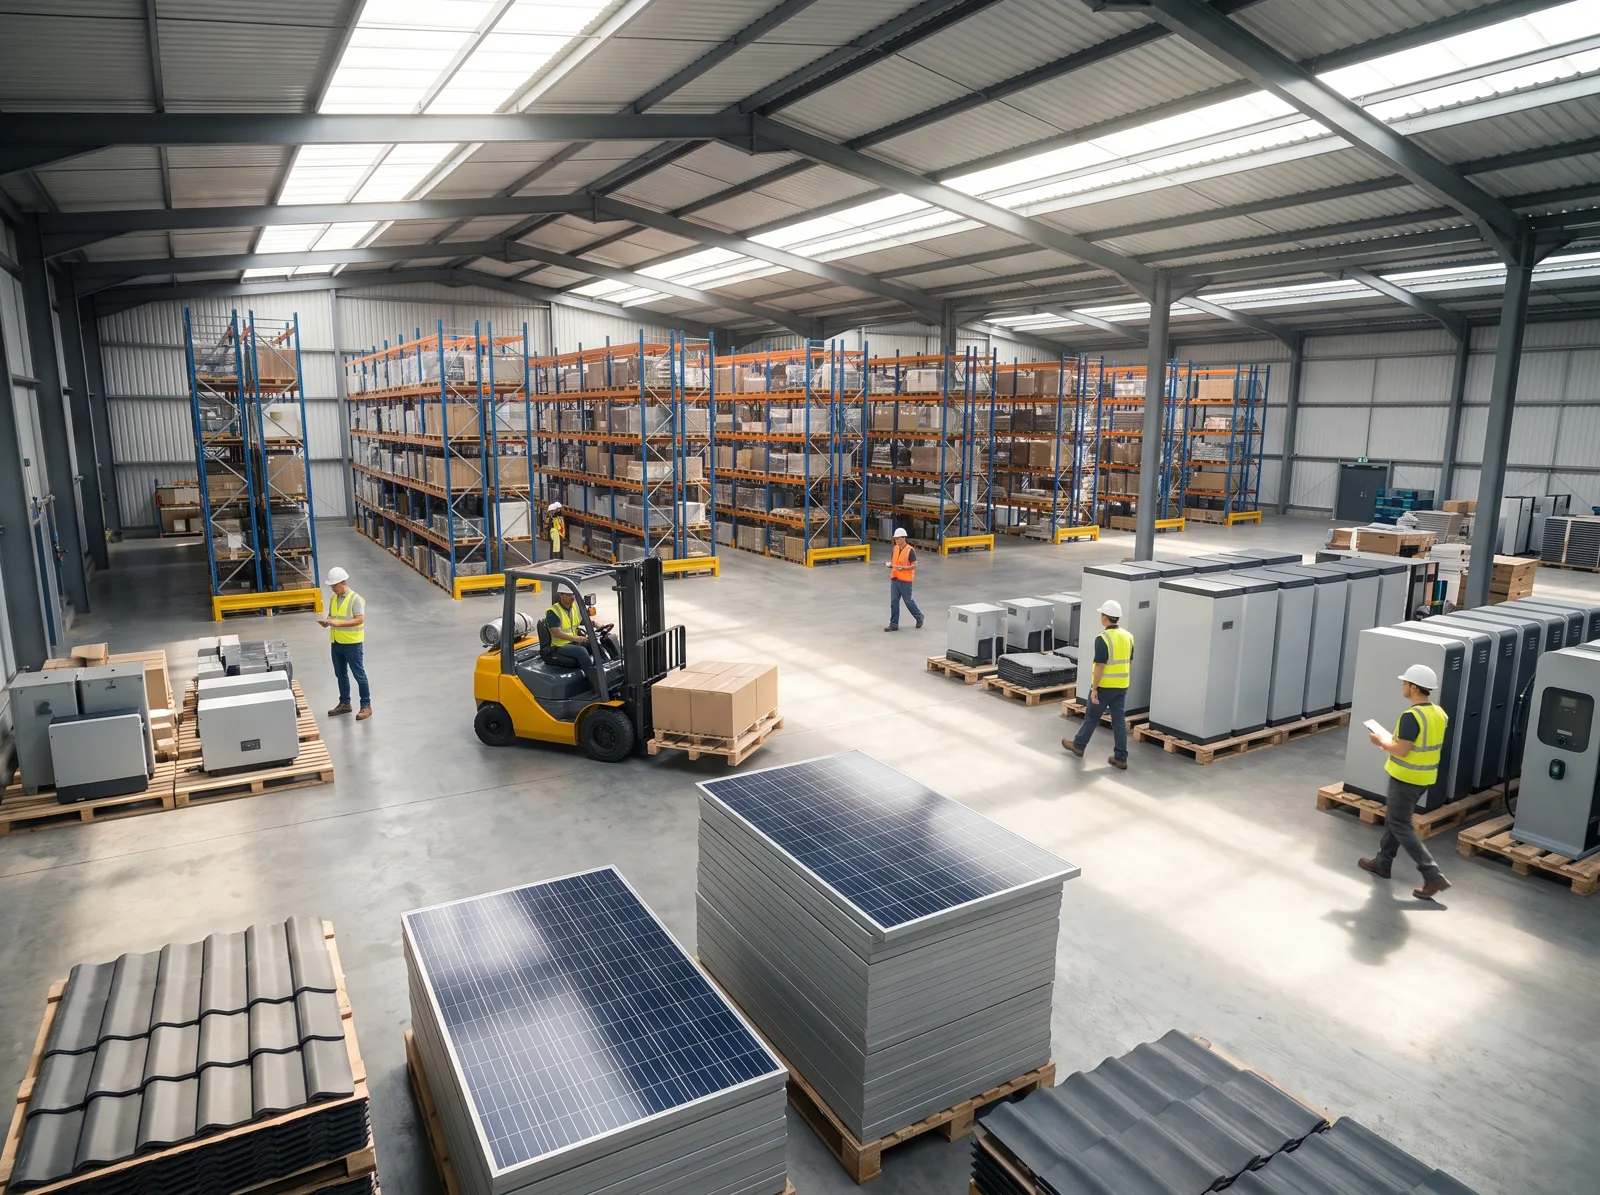
Field-sized flat roofs and compressors that never stop. The fastest payback in our fleet.
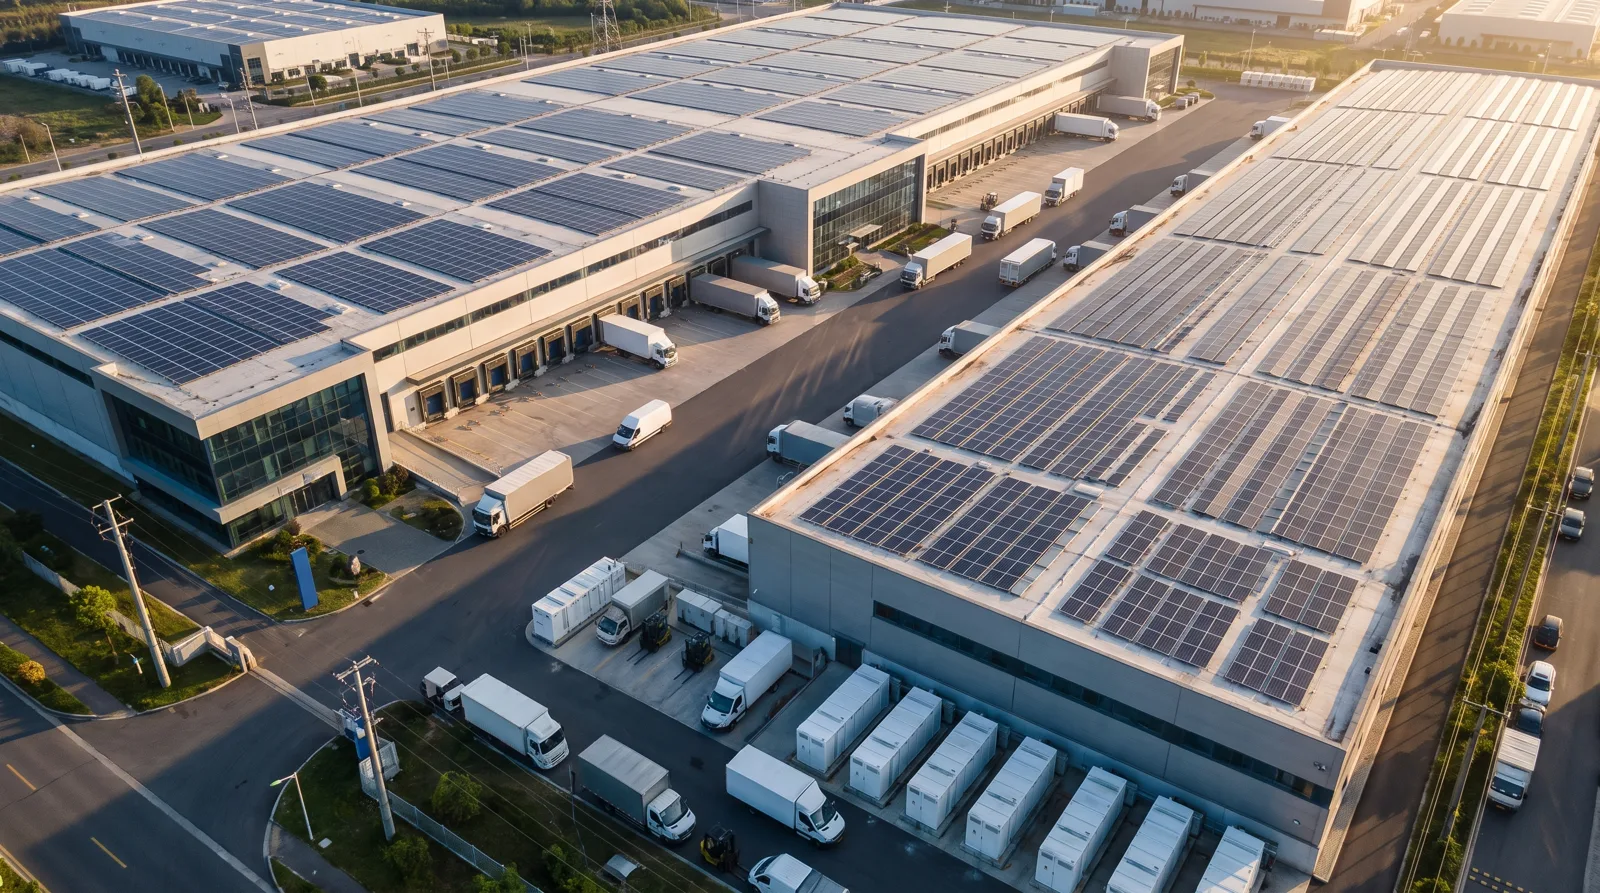
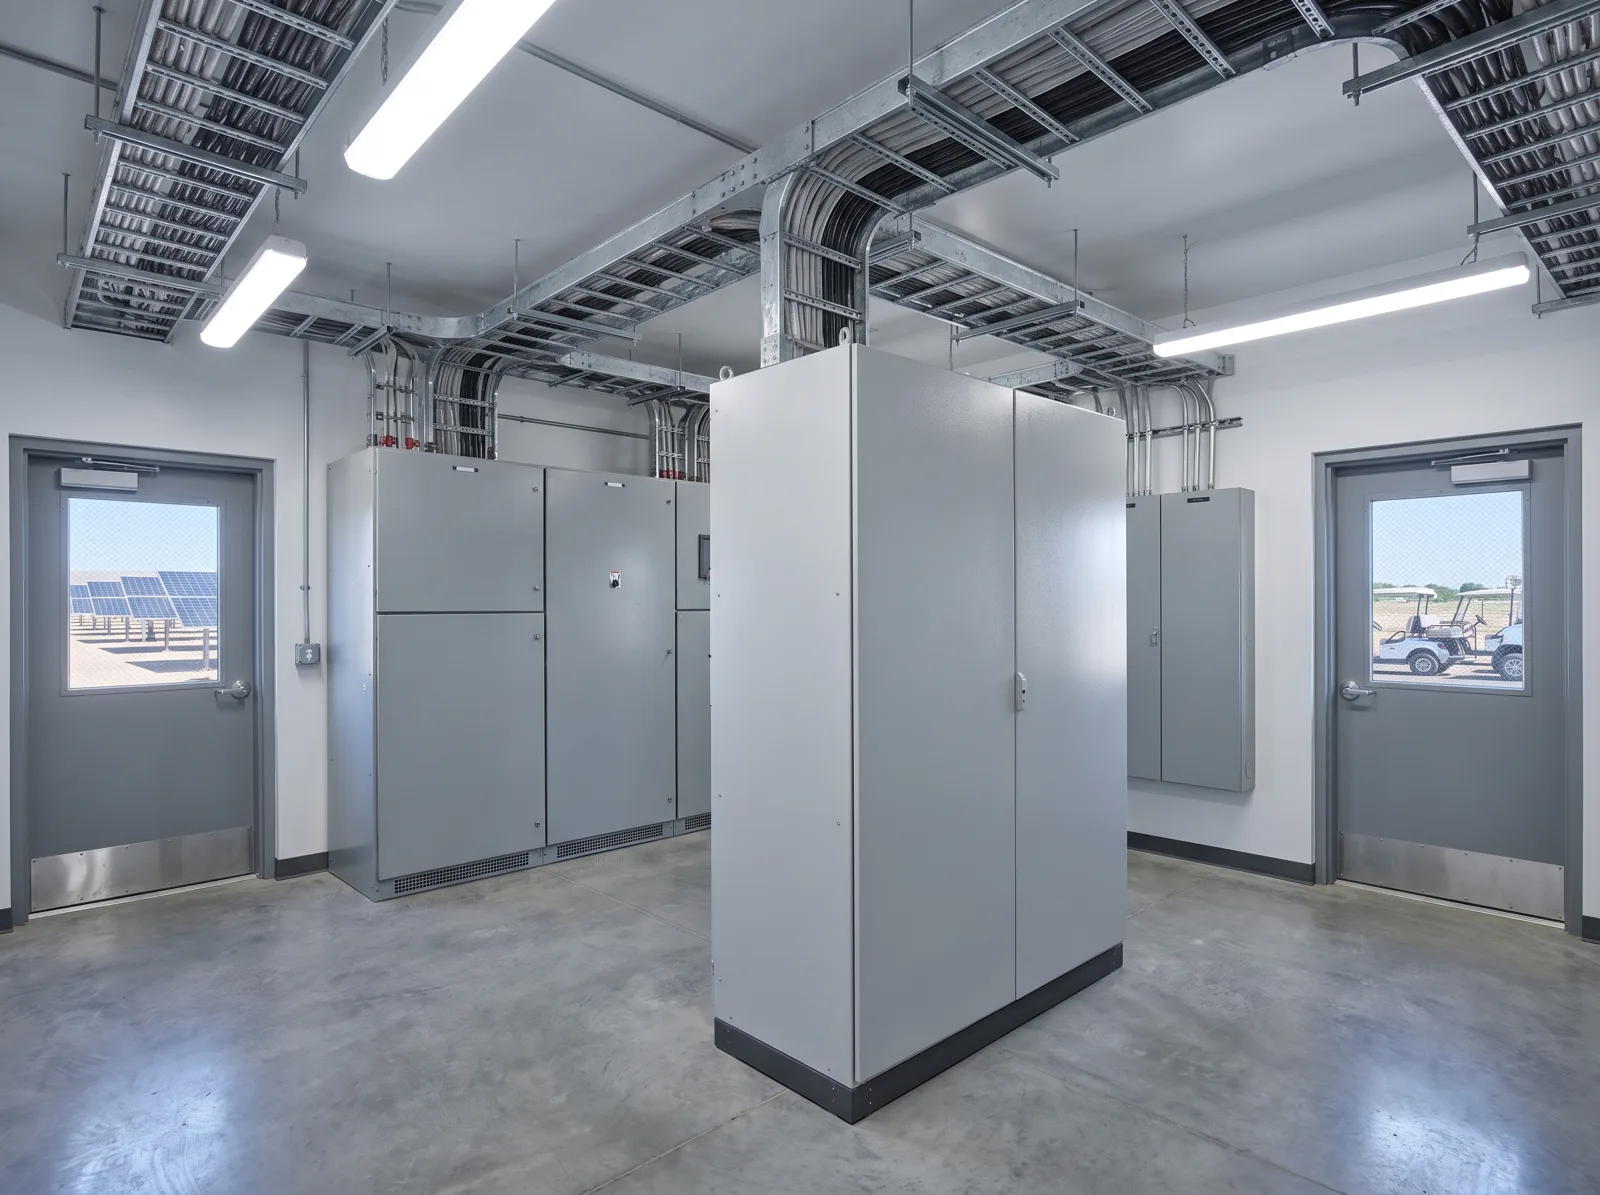
Two shifts, a sharp daytime peak and demand charges worth cutting before anything else.
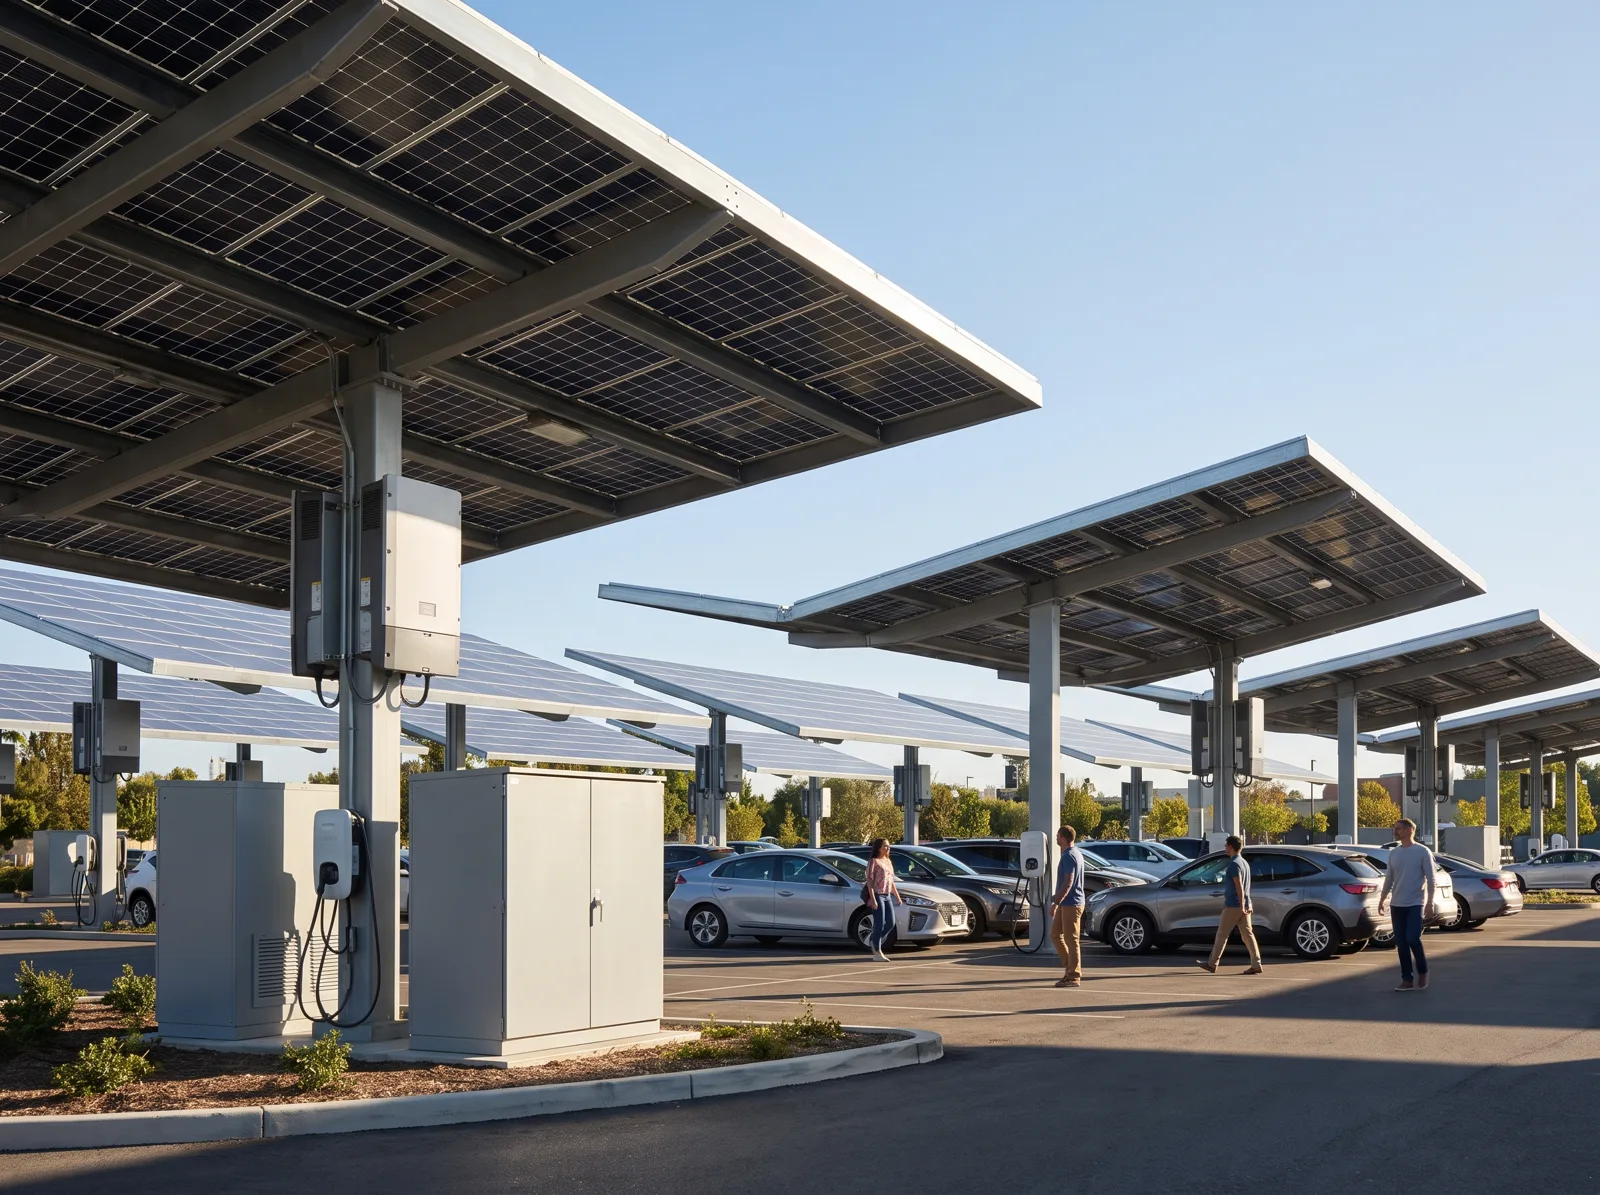
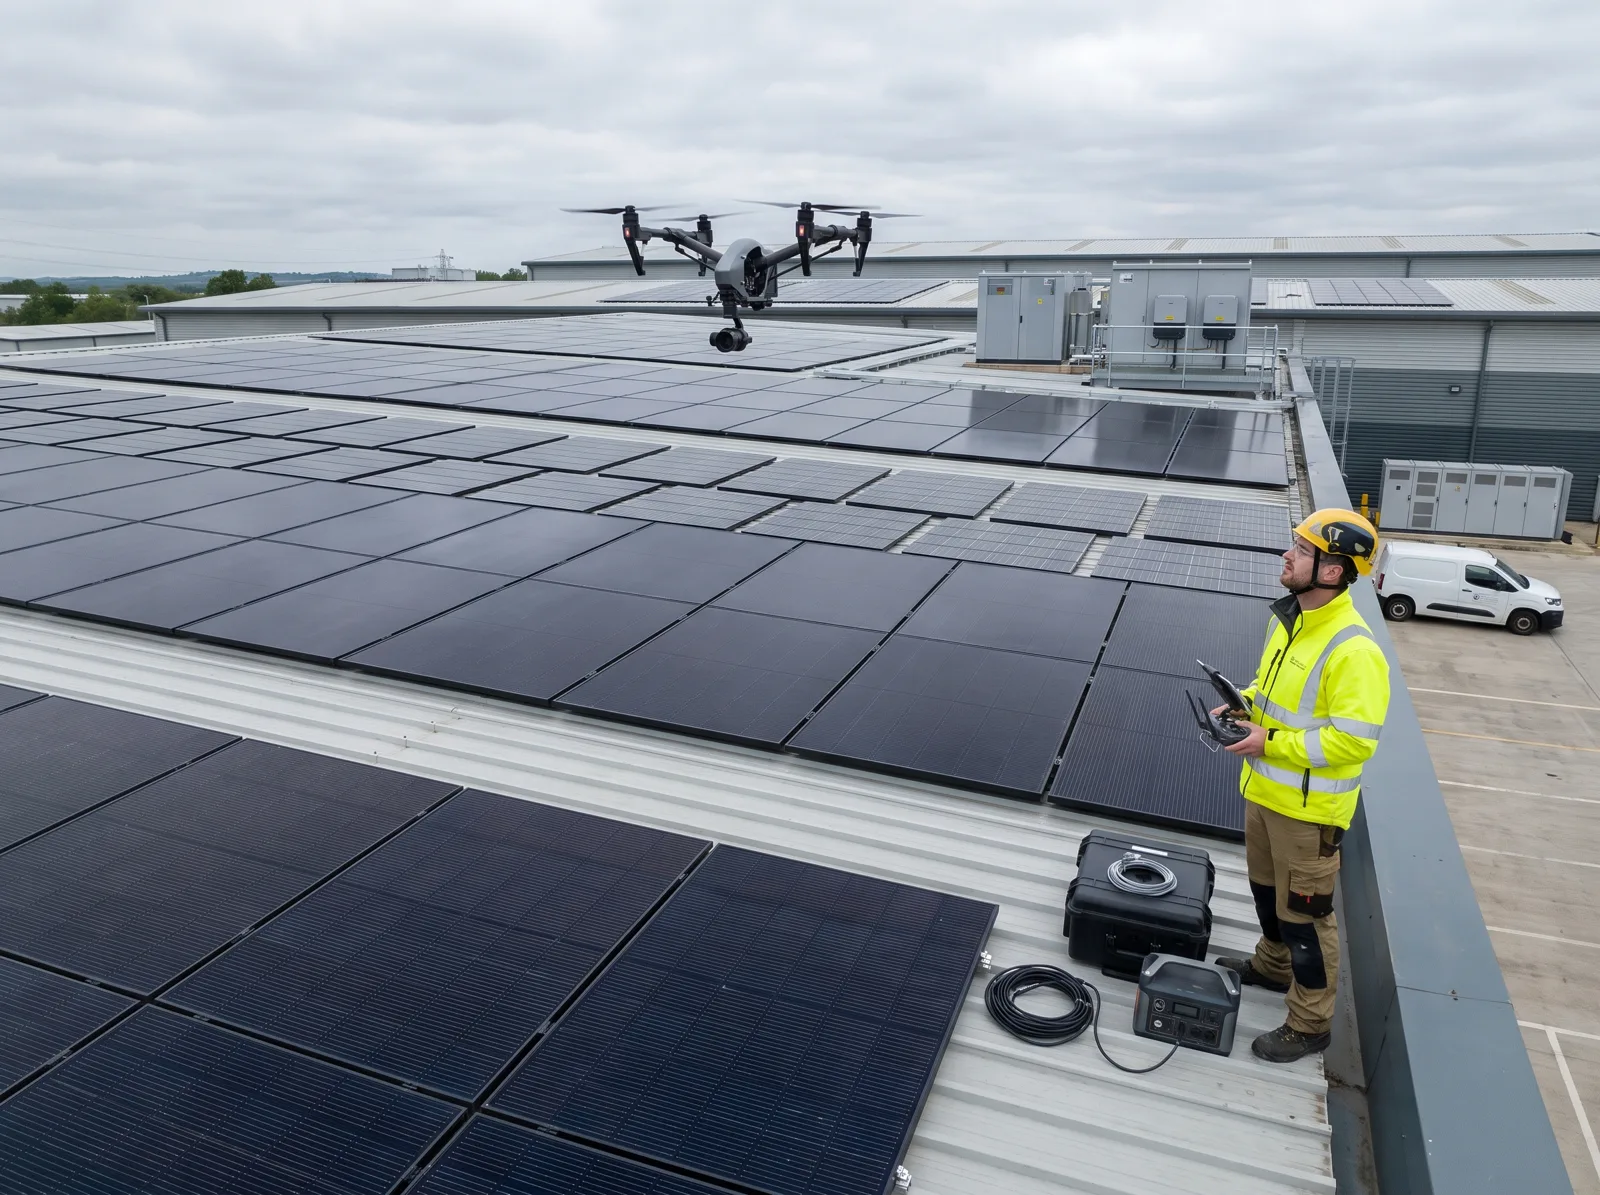
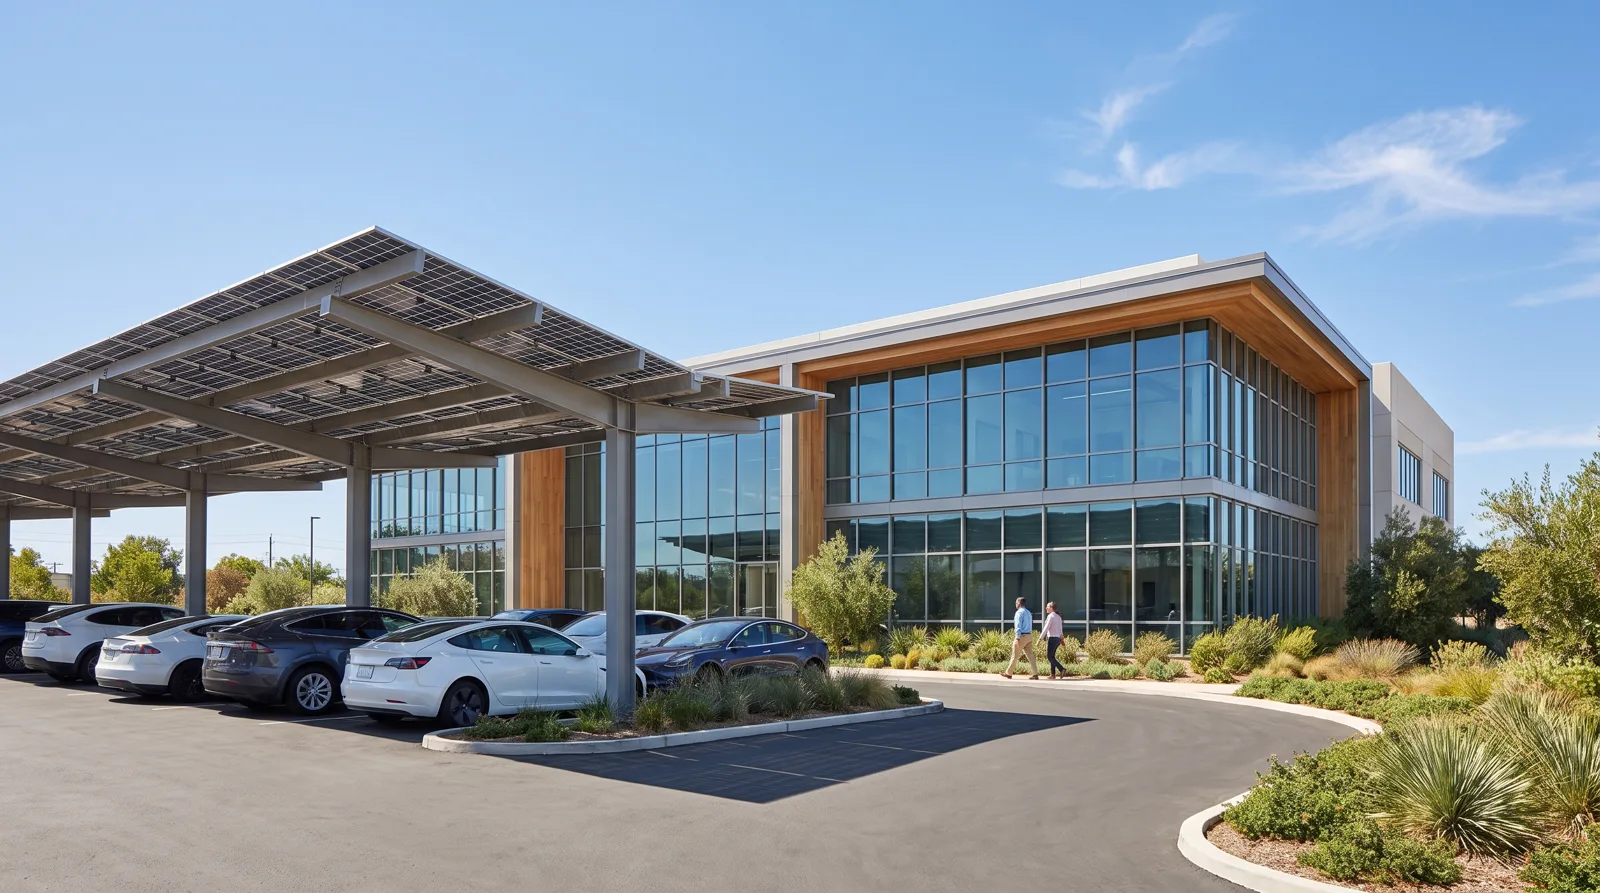
Long opening hours, heavy HVAC and car parks that are waiting for canopies.
Many buildings on one meter plan, with term-time swings the model has to respect.
Solar only saves money when it lands on load you would otherwise buy. These are anonymised medians from client interval data; the indigo share is what a right-sized array covers.
A first sense-check before you send any data. If your site sits outside these ranges, that is normal — it just means the study matters more.
SECTOR | ROOF / LAND | SYSTEM SIZE | STORAGE | PAYBACK | MOST CHOSEN |
S-01 Logistics & Cold Chain | TPO / metal, 15–40k m² | 1.2–4 MWp | 0.5–2 MWh | 4.8 yrs | PPA |
S-02 Manufacturing | Metal deck, 10–60k m² | 0.8–6 MWp | Peak shaving | 5.2 yrs | OWN |
S-03 Retail & Malls | Roof + car park | 0.4–2.5 MWp | Optional | 5.6 yrs | LEASE |
S-04 Campuses & Education | 4–20 roofs + canopies | 0.5–3 MWp | Optional | 6.1 yrs | PPA |
S-05 Healthcare | Concrete / membrane | 0.6–2.5 MWp | 1–4 MWh backup | 6.4 yrs | LEASE |
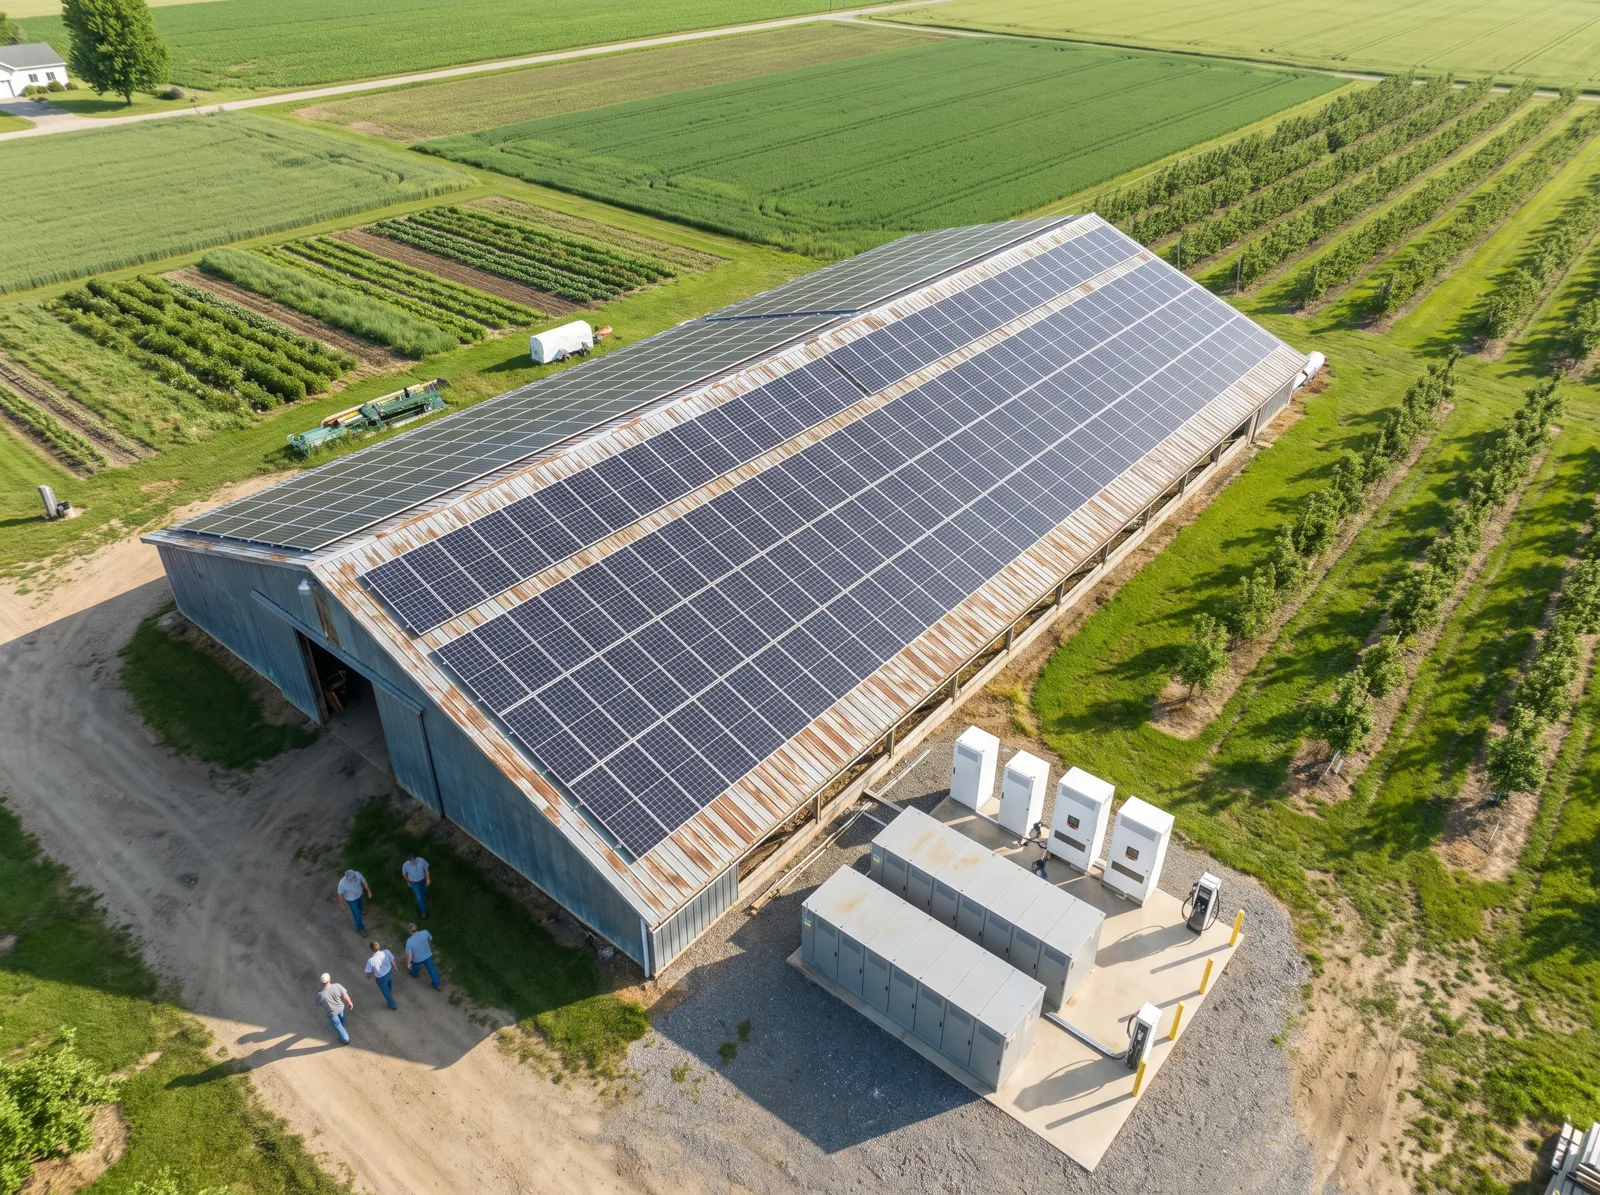
S-06 Agriculture & Food | Barn roof + spare land | 0.25–5 MWp | Cold-room buffer | 5.0 yrs | OWN |