FLEET STATUS · 338 / 340 sites online · uptime 99.6% (2025)
Mon–Fri 7:00–18:00 CT     Careers     Client Portal
SALES DESK
+1-555-0188
HEAD OFFICE
1180 Meridian Pkwy, Ashford TX
FEASIBILITY
10-day desk study, no fee
C&I / Design · Build · Finance · Operate

Solar engineered for sites that never switch off.

Rooftop, carport and ground-mount systems for factories, logistics hubs, retail and campuses — modelled on your interval data, built by our own crews and backed by a yield guarantee in the contract.
TYPICAL PAYBACK
4–6 years
PPA RATES FROM
$0.068 / kWh
YIELD GUARANTEE
95% of P90
IN-HOUSE O&M
24 / 7 / 365
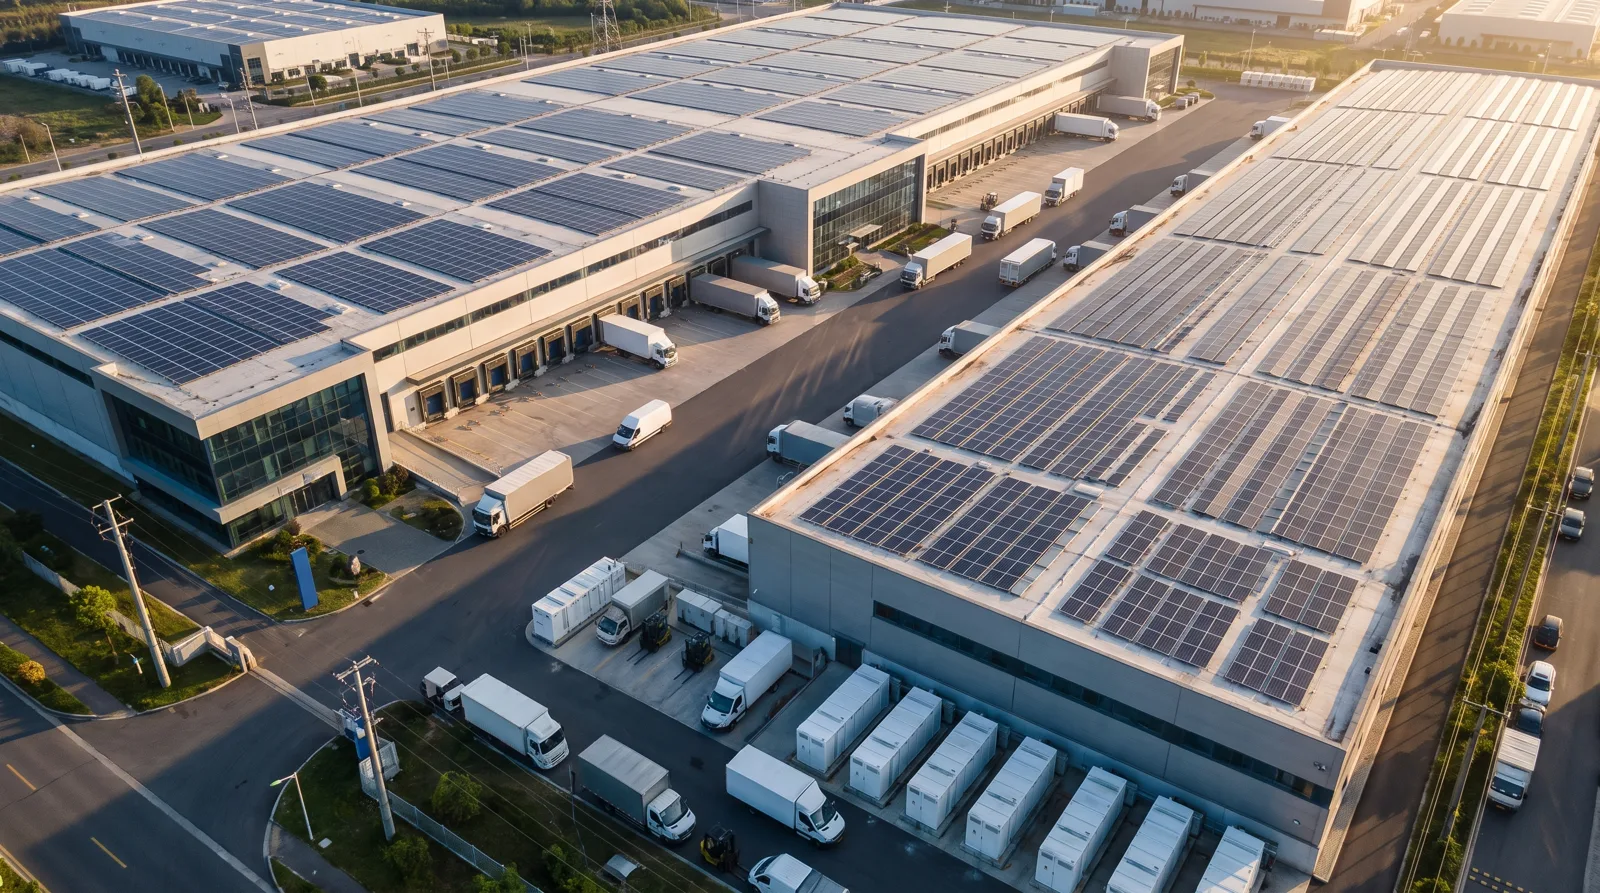
Aerial view of a logistics warehouse with a rooftop solar array and loading docks
1.2 MWp · 2,880 MODULES · 26,000 m² ROOF
SITE NB-0412 · LIVE
13:42 CT
AC output
842kW
Energy today
5.94MWh
Performance ratio
86.4%
FIG. 01 — Harbor Logistics, Ashford TX · 15-yr PPA · energised May 2025
[01] SITES COMMISSIONED
340+
Factories, DCs, retail and campuses in 14 states
[02] INSTALLED CAPACITY
410MWp
Rooftop 61% · carport 17% · ground 22%
[03] FLEET UPTIME 2025
99.6%
Monitored 24/7 from our Ashford ops centre
[04] CARBON AVOIDED
224ktCO₂/yr
From ≈ 574 GWh of clean generation a year
OPERATORS RUNNING
ON NORTHBEAM POWER
HARBORLINE
Kestrel Foods
ARCVALE
Monoline
TAMSIN
COLD CHAIN
orbiscampus
01 / What we build

Five system types. One engineering team from survey to year 25.

We don’t resell kits. Every array is designed by our own licensed engineers to your roof’s load tables and your tariff, then built and maintained by the same team.
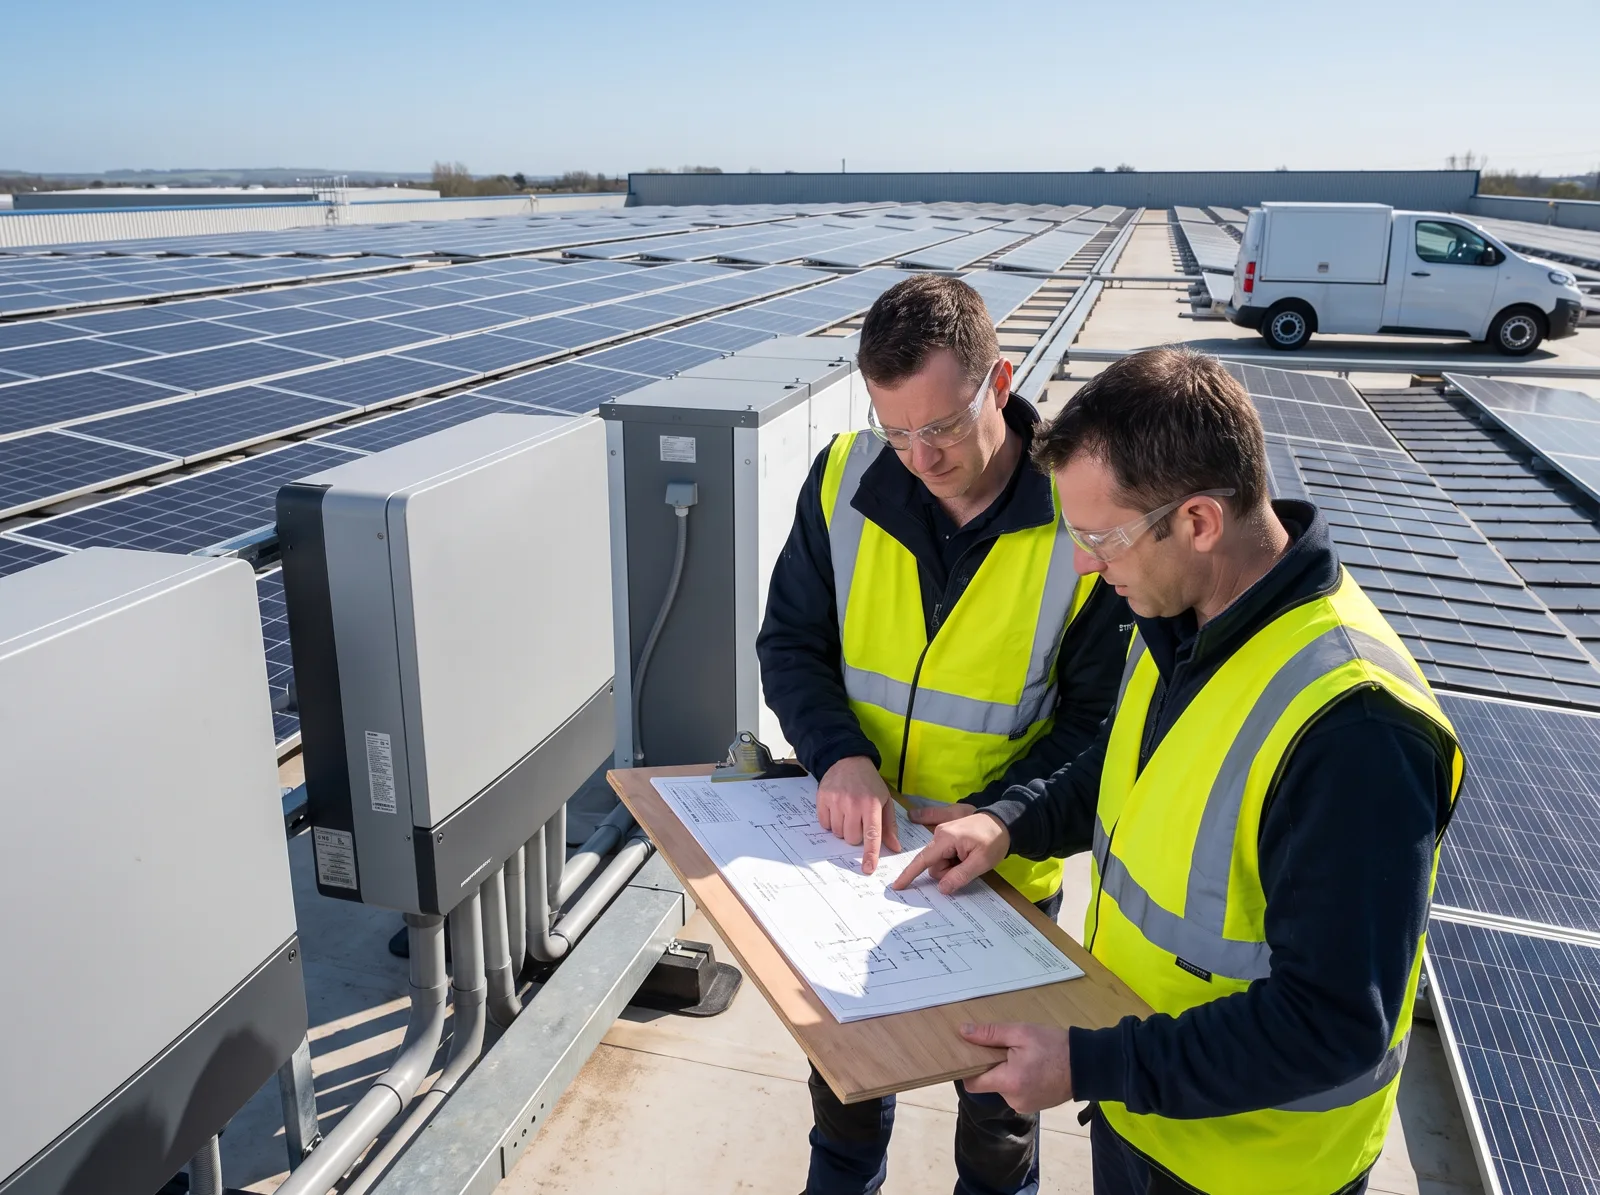
Two engineers in hi-vis vests reviewing a drawing on a solar roof
S-01 · ROOFTOP PV

Rooftop Arrays

Ballasted or rail-mounted on metal, TPO and concrete decks — laid out around skylights, HVAC and fire setbacks.
RANGE
250 kWp – 6 MWp
SPECIFIC YIELD
1,380–1,520 kWh/kWp
SHARE OF FLEET
61%
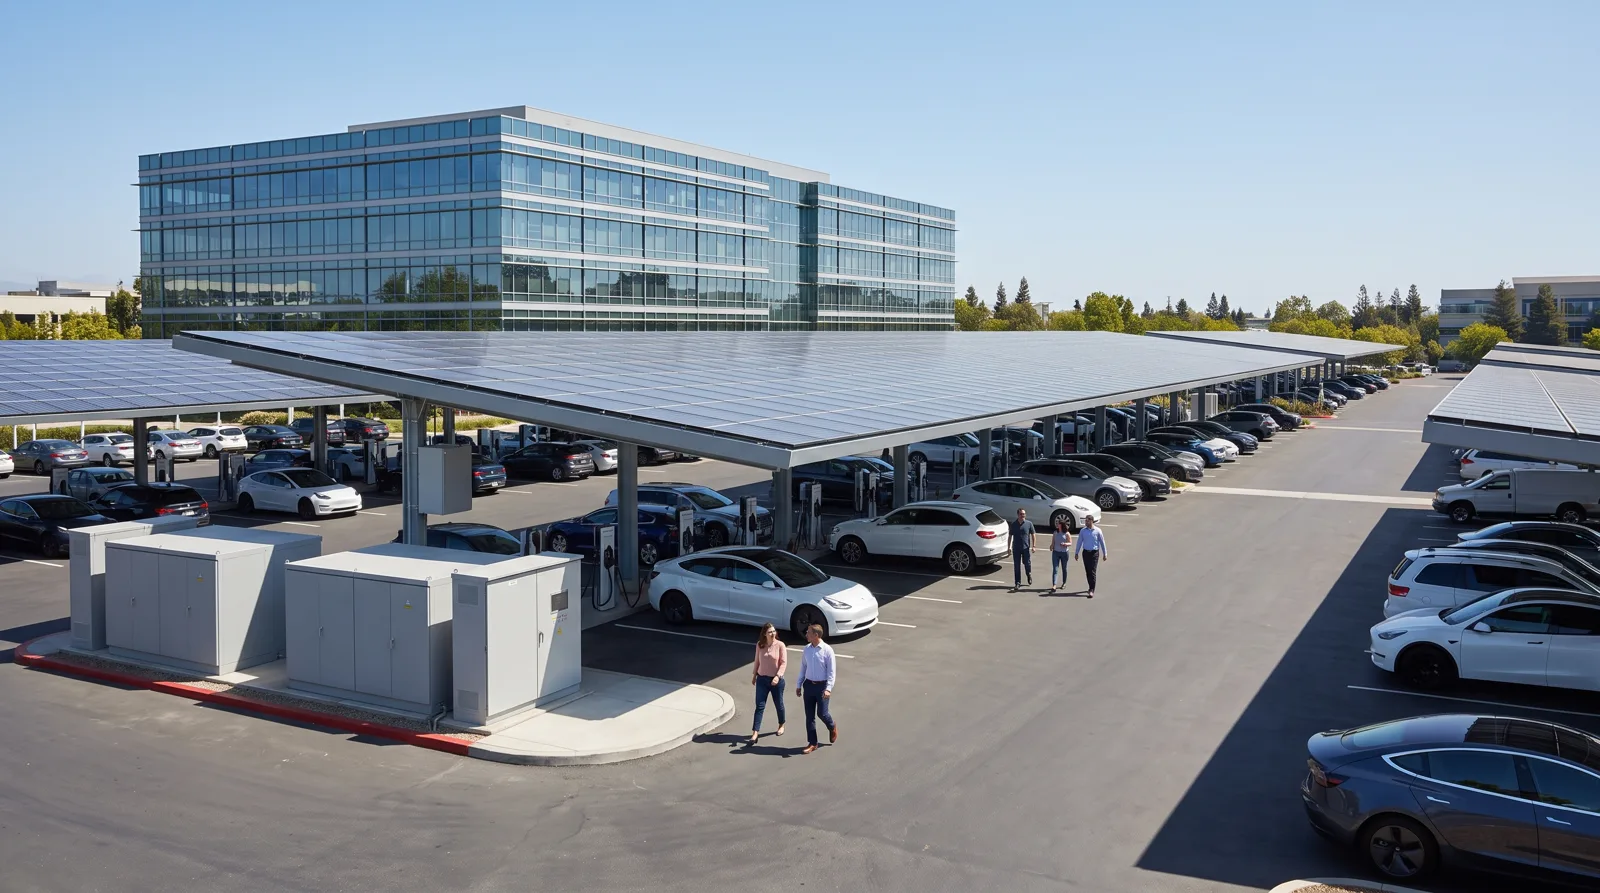
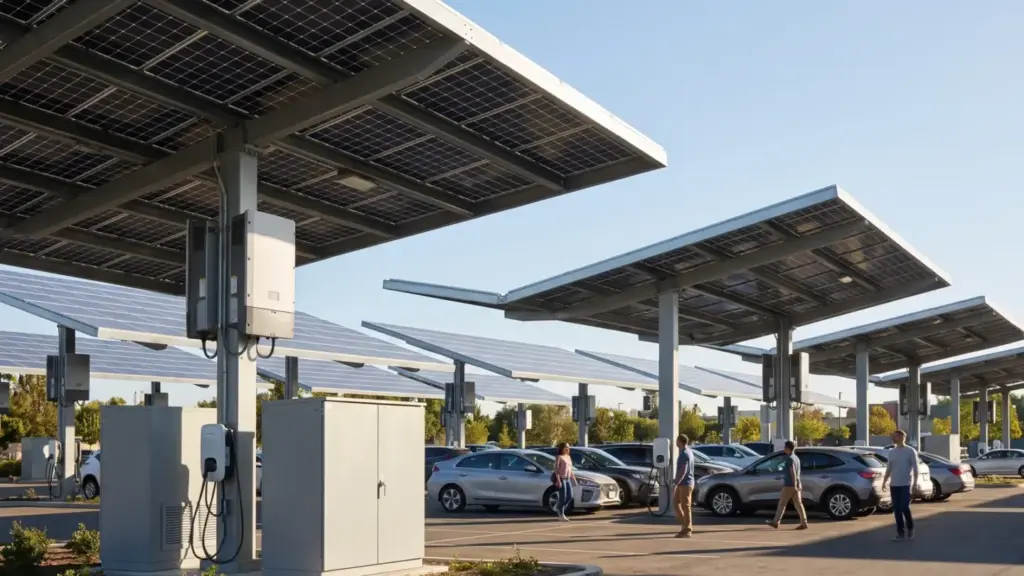
Solar carport canopies over a staff car park with EV chargers
S-02 · CARPORT

Solar Carports

Steel canopies that shade staff parking and feed EV chargers below — engineered for 140 mph wind.
BAYS
40 – 900
CHARGING
Level 2 + DC fast
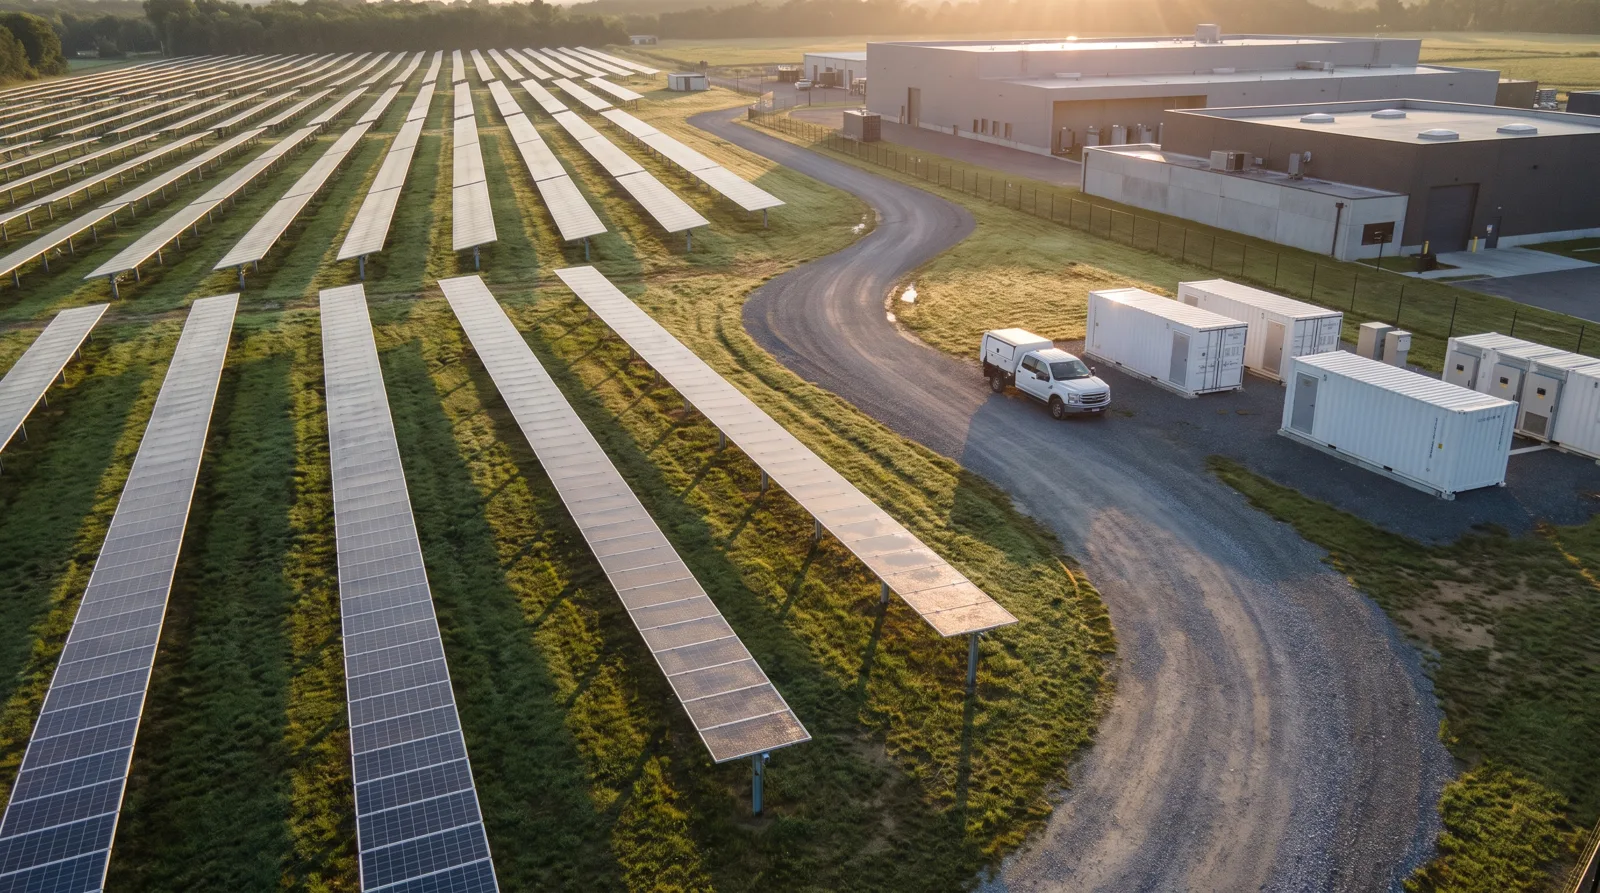
Ground-mounted solar rows beside a gravel service road
S-03 · GROUND-MOUNT

Ground-Mount Fields

Fixed-tilt or single-axis trackers on spare land, connected at medium voltage.

RANGE
1 – 25 MWp
TRACKER GAIN
+18% yield
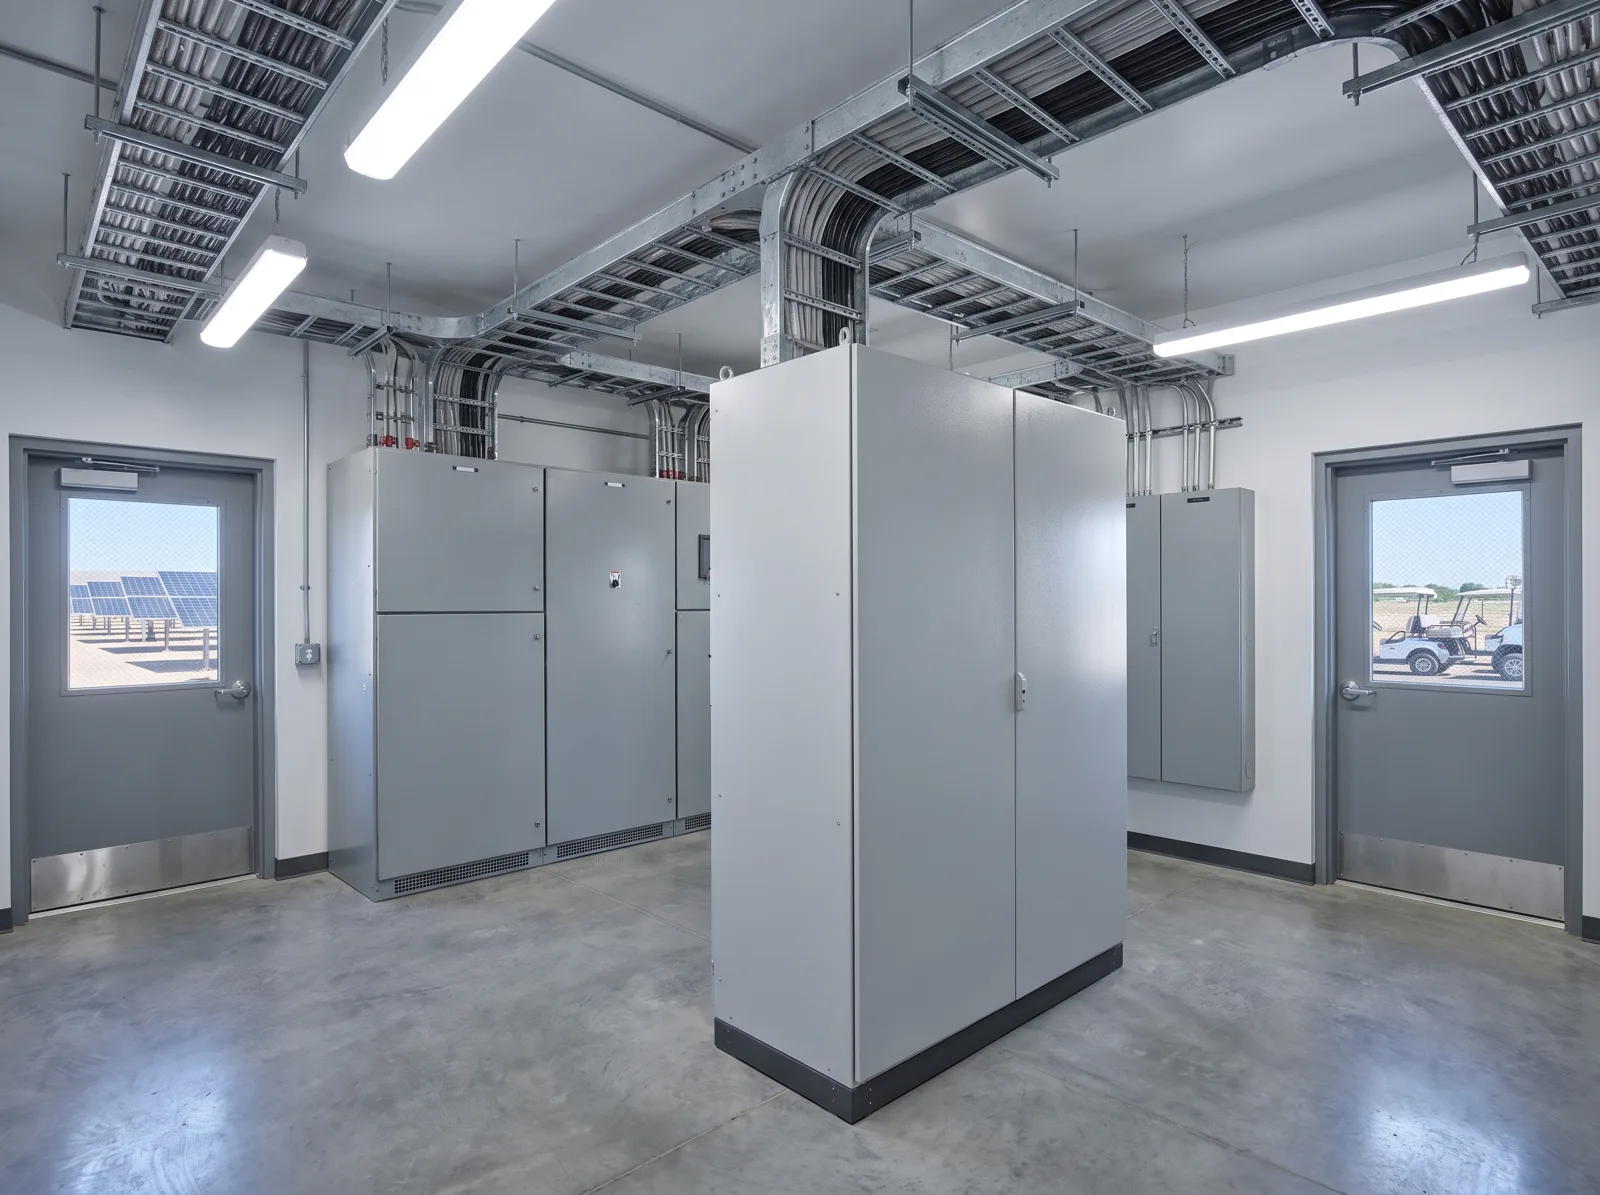
Battery storage cabinets in a clean electrical room
S-04 · STORAGE

Battery Storage

Clips demand charges and keeps critical lines running through grid outages.

CAPACITY
250 kWh – 20 MWh
PEAK CUT
up to 38%
S-05 · O&M + DRONE
THERMAL DRONE SURVEY
EVERY 6 MONTHS
99.6%

Operations & Maintenance

Fleet uptime in 2025 across every site we monitor — ours or someone else’s.

FAULT SLA
< 4 h on site
REPORTING
Monthly, per string
02 / Sectors

Sized to how your site actually uses power.

A cold store, a two-shift plant and a hospital campus draw power in completely different shapes. We start from 12 months of interval data, not a rule of thumb.
01
Logistics & Cold Chain
Flat roofs, 24/7 refrigeration
02
Manufacturing
Two-shift, high daytime peak
03
Retail & Malls
Long hours, big car parks
04
Campuses & Education
Many buildings, one meter plan
ALSO ENGINEERED FOR
Data centres · agriculture · water utilities · public sector
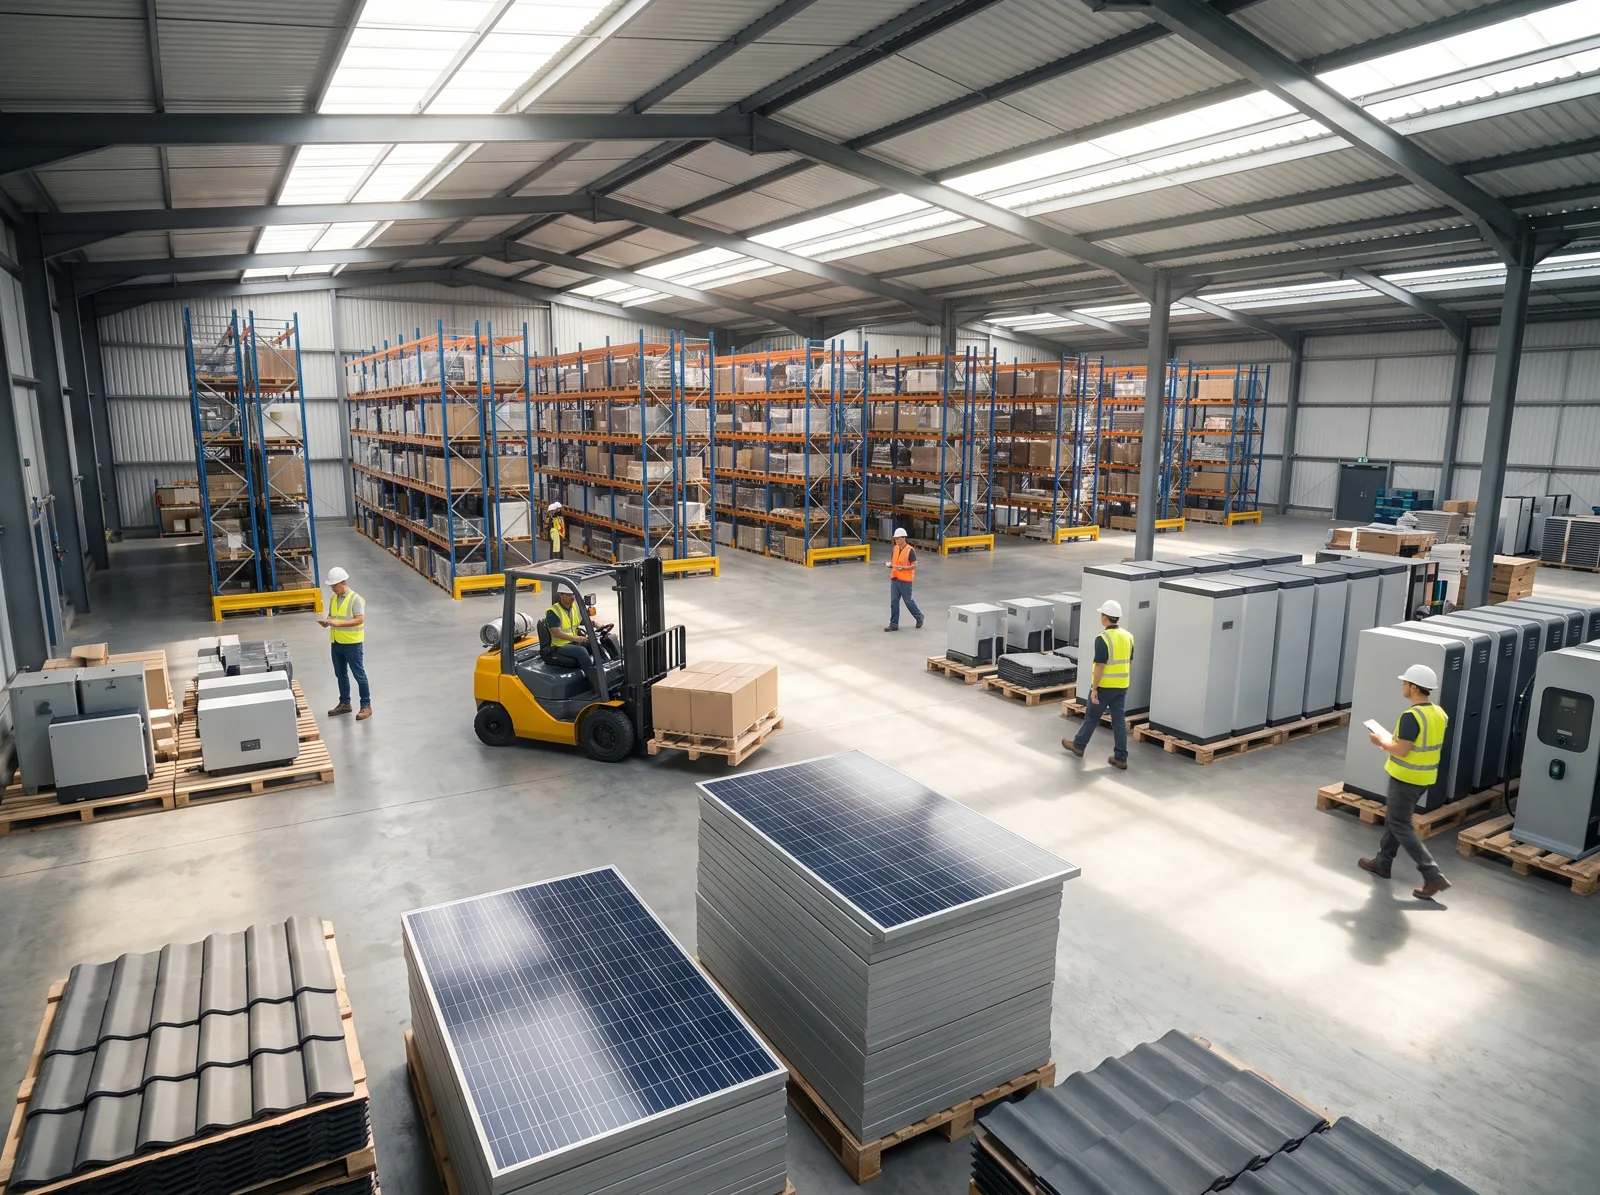
Warehouse interior with racking, a forklift and pallets of solar modules

Logistics & Cold Chain

Roofs the size of football fields and compressors that run all day — distribution centres pay back fastest. We pair arrays with storage to flatten the evening compressor peak.

Roof load survey on every bay
Work scheduled around dock hours
Backup on critical cold-store circuits
DAYTIME LOAD COVERED
62%
TYPICAL SIZE
1.2–4 MWp
PAYBACK
4.8 years
03 / The numbers

Three ways to pay. One model your CFO can audit.

Buy the power, lease the system or own it outright. Every proposal shows all three side by side, built from the same yield model and the same assumptions.

MODEL
PPA
MOST CHOSEN · 54%
Lease
18% OF SITES
Own
28% OF SITES
UPFRONT COST
$0
$0
Full system cost
YOU PAY
Per kWh, from $0.068
Fixed monthly rent
Nothing after build
TERM
10–20 years
7–15 years
System life, 30+ yrs
O&M + INSURANCE
Included
Included
Optional contract
INCENTIVES
Priced into rate
Priced into rent
Yours, where they apply
BEST FOR
Keeping capex at zero
Predictable opex
Highest lifetime return
AVG. PPA VS GRID
−27%
RATE ESCALATOR
0–2% / yr
CONTRACTS SIGNED 2025
41
ROI MODEL · EXAMPLE
OWN · 25 YRS
1.2 MWp distribution centre
Ashford, TX · 1,450 kWh/kWp · grid tariff $0.098/kWh
SIMPLE PAYBACK
4.7yrs
25-YEAR IRR
19.2%
YEAR-1 SAVINGS
$170k
LCOE
$0.041/kWh
System cost ($0.95/Wp)
$1,140,000
Investment incentive (example 30%)
−$342,000
Annual generation
1,740 MWh
CO₂ avoided
679 t / yr
Illustrative only. Incentives vary by location; your model uses the programmes that apply to your site and your own 12 months of interval data.
04 / Featured project

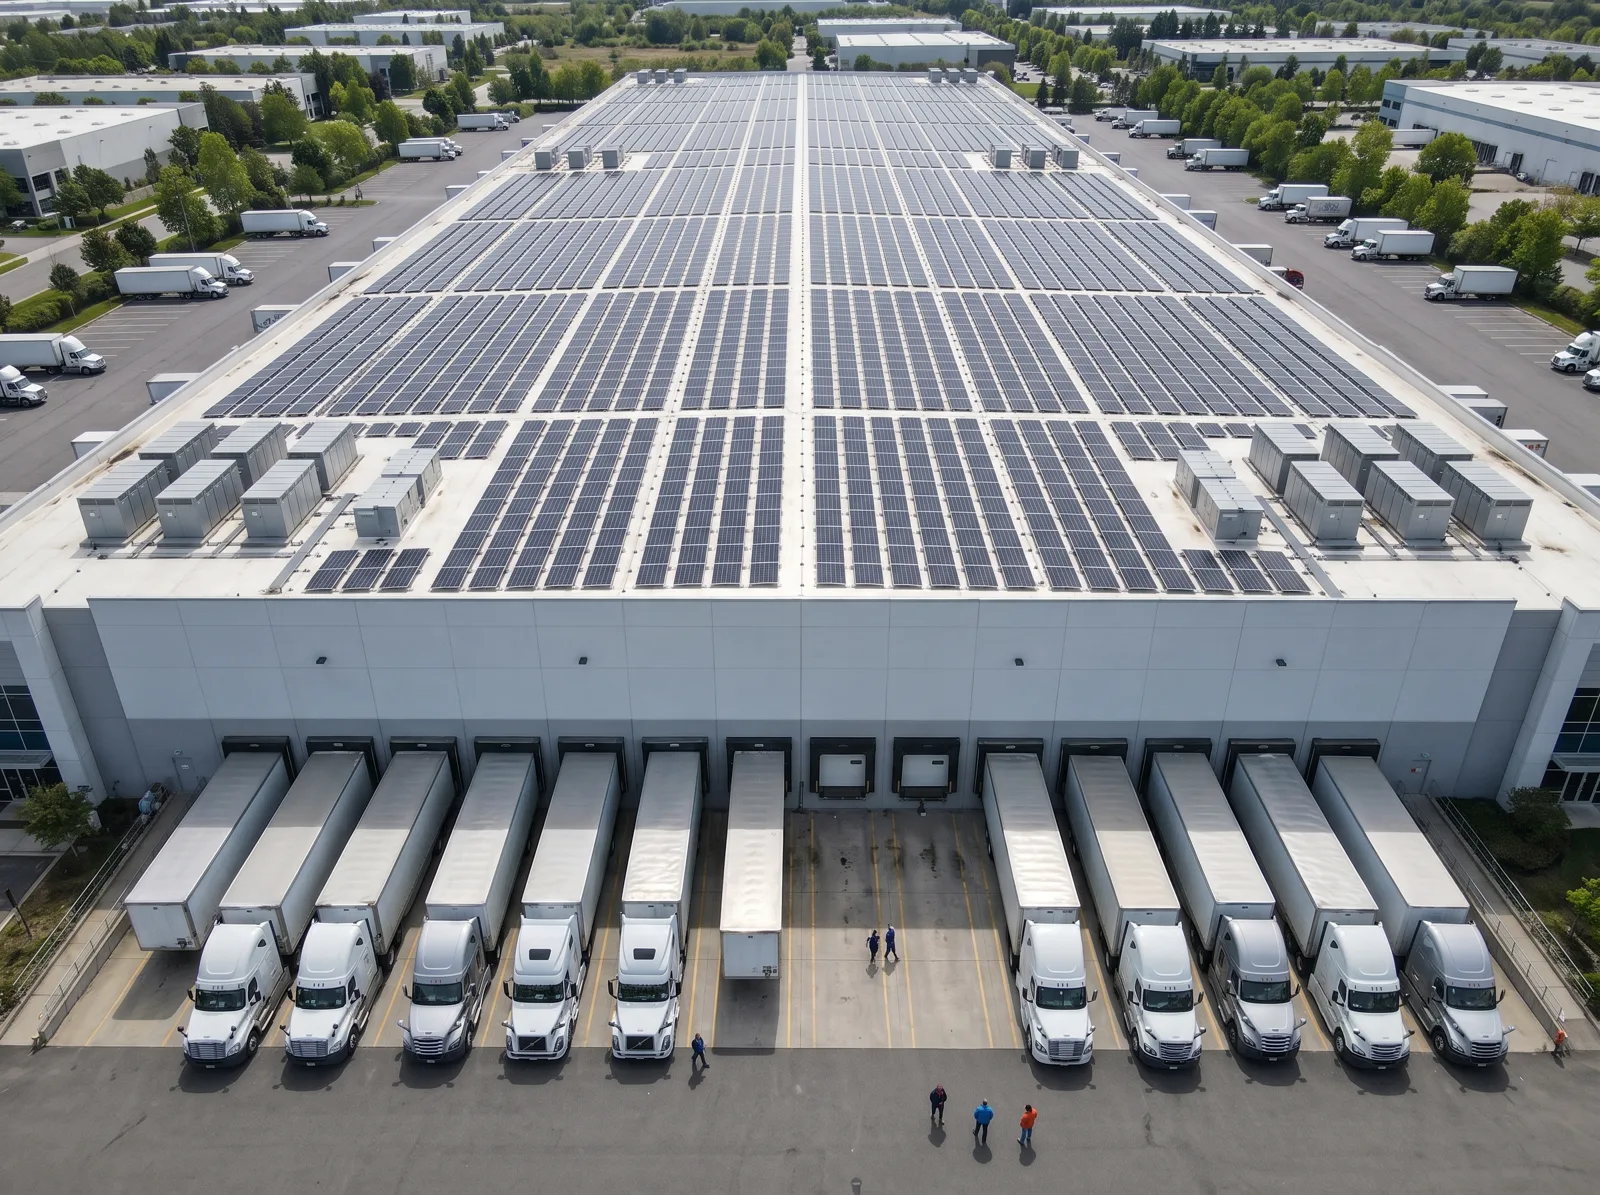
Harbor Logistics cut grid spend 31% in year one.

Distribution centre roof covered in solar modules above parked trucks
NB-0412
LOGISTICS · ROOFTOP + STORAGE
FIG. 02 — 2,880 bifacial modules on a 26,000 m² TPO roof
ENERGISED MAY 2025
SPEC SHEET · HARBOR LOGISTICS
REV. C
CAPACITY (DC)
1.2 MWp
MODULES
2,880 × 420 W bifacial
INVERTERS
10 × 100 kW string
STORAGE
500 kWh / 250 kW
ANNUAL YIELD
1,742 MWh
SELF-CONSUMPTION
91%
COMMERCIAL MODEL
15-yr PPA, $0.068/kWh
ROOF TO ENERGISED
11 weeks
−31%
GRID SPEND
679 t
CO₂ / YEAR
102%
OF P50 YIELD
REF.
PROJECT
SECTOR
CAPACITY
YEAR
NB-0398
Ashford Civic Solar Canopy
Carport · 64 bays
310 kWp
2025
NB-0377
Kestrel Foods Packhouse
Food processing
640 kWp + 1 MWh
2024
NB-0351
Orbis Medical Campus
Healthcare · 6 buildings
2.1 MWp
2024
NB-0329
Monoline Retail Park
Retail · rooftop + carport
880 kWp
2023
05 / Delivery programme

From desk study to energised in about 26 weeks.

One programme, one project manager, one weekly report. Utility timelines are the only thing we don’t control — so we start that paperwork in week six, not after design.
PHASE · DELIVERABLE
W0
W4
W8
W12
W16
W20
W24
01
Feasibility
Layout, yield model, 3 price options
2 WKS
02
Design & engineering
Structural report, IFC drawings, SLD
6 WKS
03
Permits & interconnection
Utility approval, building permit
12 WKS · UTILITY-LED
04
Build & commissioning
Own crews, witnessed test report
7 WKS
05
Operate & maintain
Monthly performance report
25 YRS
 
NORTHBEAM ENGINEERING
 
UTILITY / AUTHORITY TIMELINE
 
SITE WORKS
 
OPERATIONS
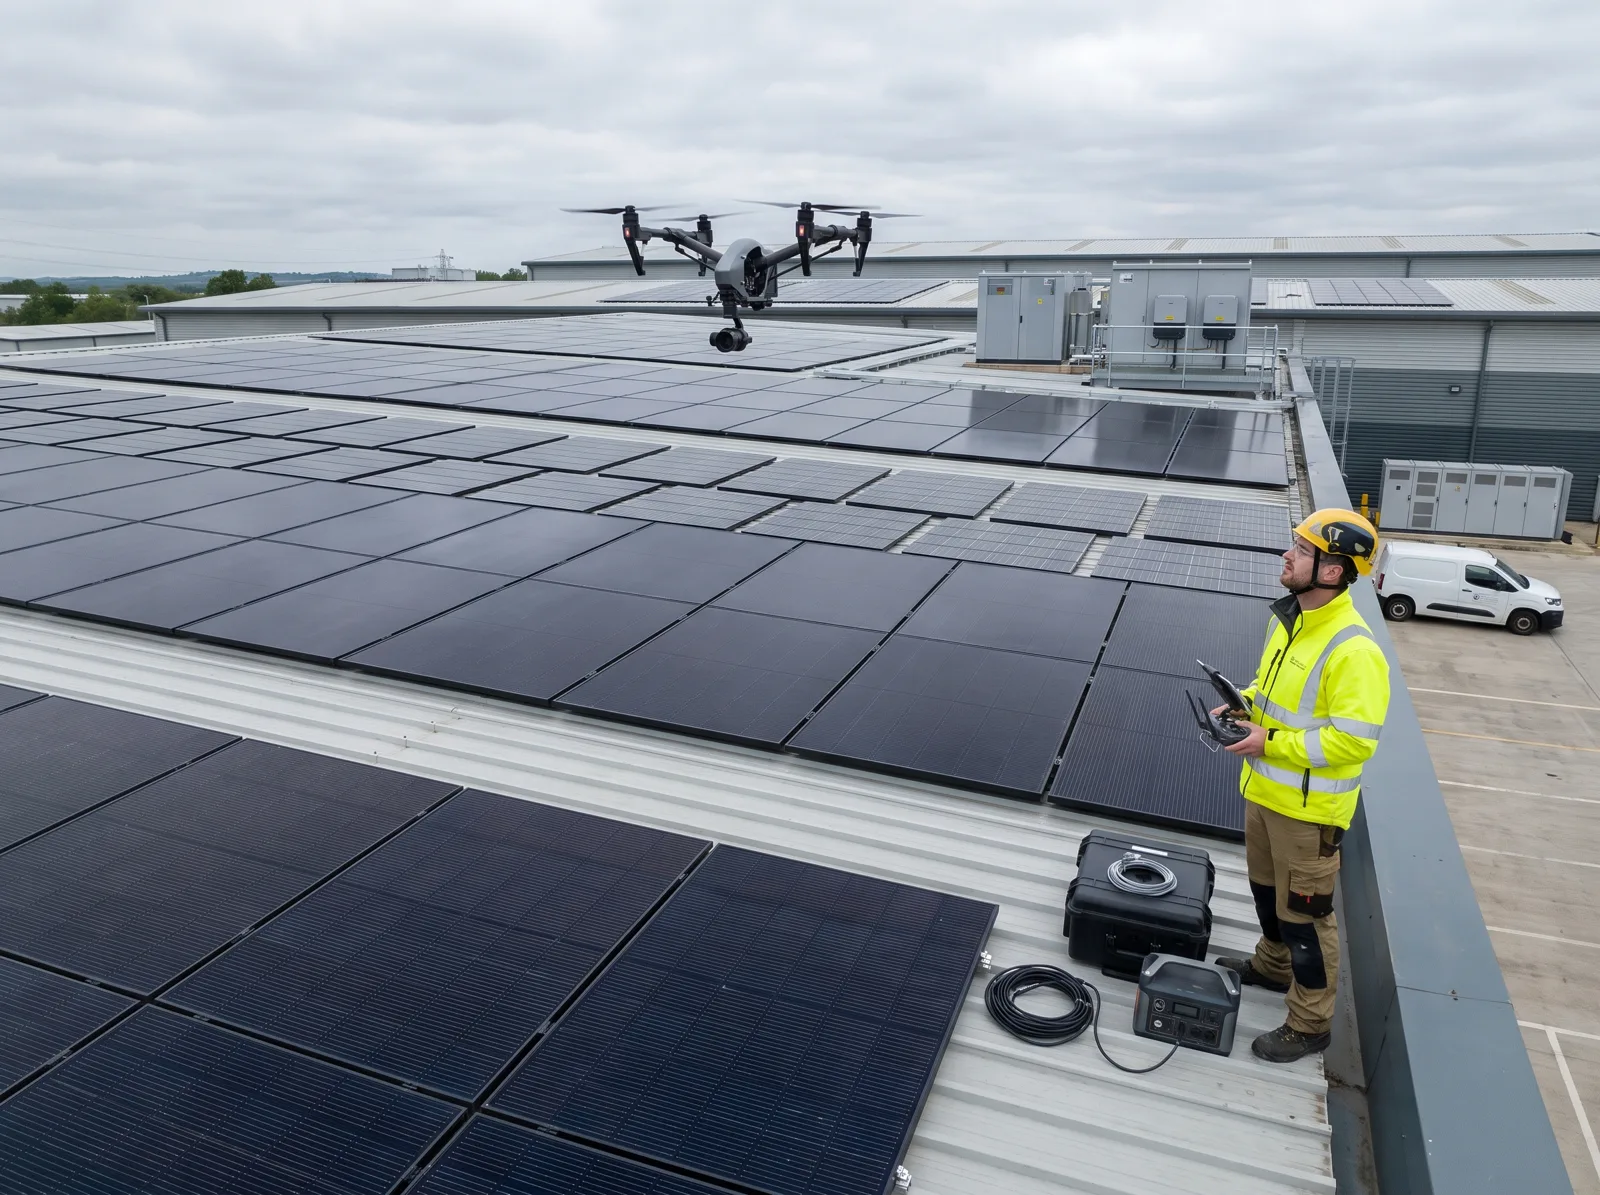
Technician flying an inspection drone over a rooftop solar array
IR SURVEY · NB-0412 · ROW 14
Hot-spot on string 14-B
+18 °C over row average
Ticket closed in 3 h 12 min
Connector replaced, string restored
06 / Operations centre

Every string watched, every 15 minutes.

Our Ashford operations centre reads 340+ sites around the clock. Drones fly thermal surveys twice a year, and our own technicians — not subcontractors — roll to every fault.
< 4h
Fault response, contract SLA
2× / yr
Thermal drone surveys per site
96k
Data points read per site, daily
38
Field technicians on staff
07 / Client voice
“They modelled our cold store on real interval data, not a brochure. Eleven weeks later the roof was live — and year one came in 2% above their own P50.”
DM
Dana Mercer
VP Facilities, Harbor Logistics
BANKABILITY
Reviewed by independent engineers. Insured to $25M per project.
$1.3B
Projects financed
0
Lost-time incidents, 2025
CERTIFICATIONS & STANDARDS
ISO 9001 quality
ISO 45001 safety
IEC 61215 modules
UL 9540 storage
OSHA 30 site leads
Licensed EPC, 14 states
08 / Insights

Field notes for facilities and finance teams.

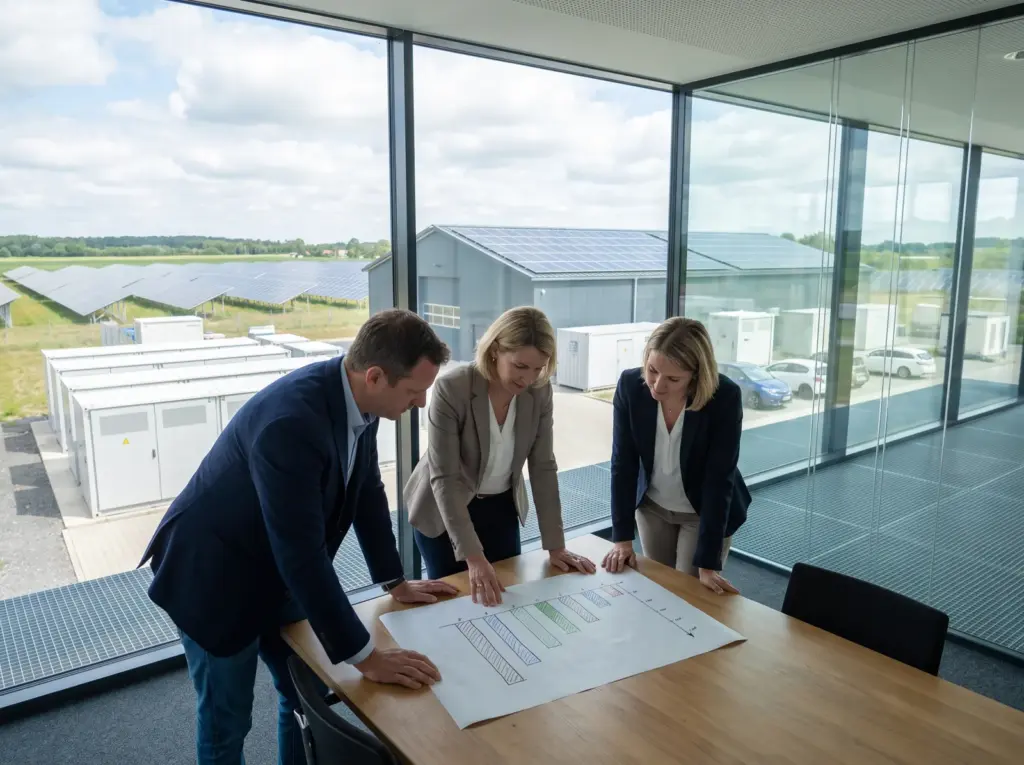
Finance and facilities team reviewing a site plan at a meeting table

PPA, Lease or Own: How CFOs Compare the Three

Same roof, three balance sheets. What changes for cash flow, accounts and risk in each model.
Read the Note
Solar canopy with EV charging cabinets over a car park

Demand Charges: Where Storage Earns Its Keep

Why one 15-minute spike can cost more than a month of energy — and how a battery clips...
Read the Note
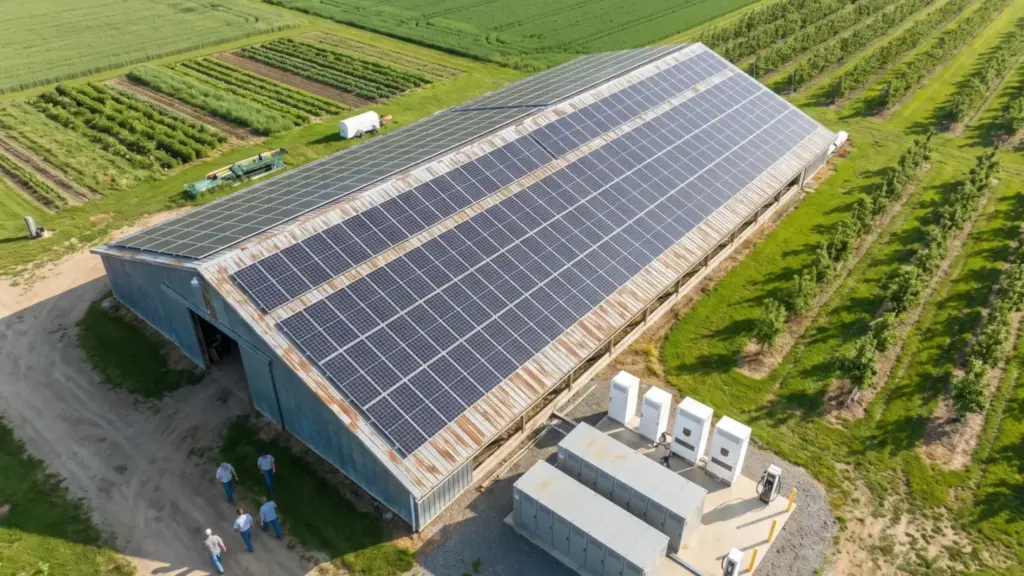
Agricultural building with a rooftop solar array among fields

Can Your Roof Take It? A Structural Checklist

Load tables, membrane age and fire setbacks: the six checks we run before any layout.
Read the Note
09 / Start here

Request a feasibility study.

Send 12 months of bills or interval data. Within 10 working days you get a layout, a yield model and prices for PPA, lease and ownership — no fee, no obligation.
DAY 1    Call with an engineer, data request
DAY 5    Satellite layout + roof load check
DAY 10    Yield model + three price options
Study request
FORM NB-FS1

    An engineer replies within one working day.