Two data halls with hot and cold air mixing in the aisles. Containment, higher supply temperatures and more free-cooling hours brought the PUE from 1.62 to 1.38 — with the IT load untouched.
Every figure comes from the Level 3 audit, the BMS trend data or the M&V reports. The IT load is metered separately, so PUE changes are cooling and power-train only.
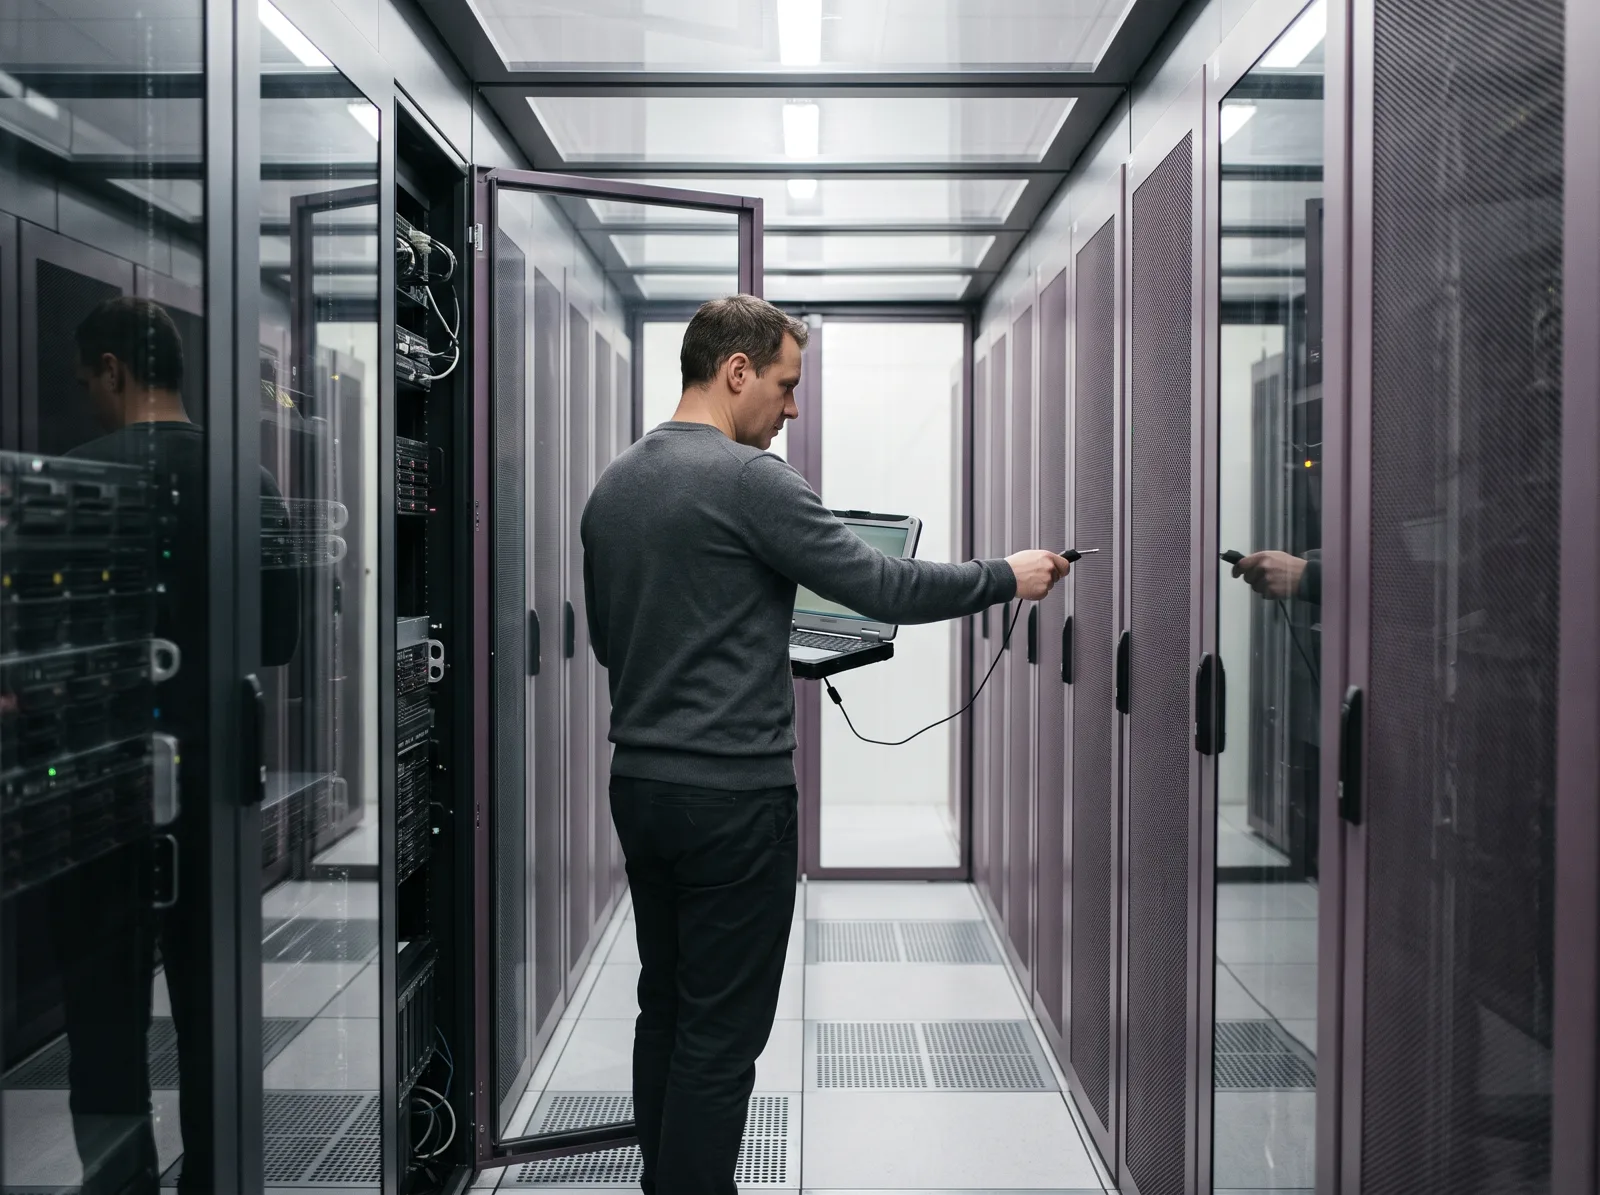
Monthly total facility energy in the baseline year and the first full year after the measures — the gap is widest in the cool months, when free cooling now runs.
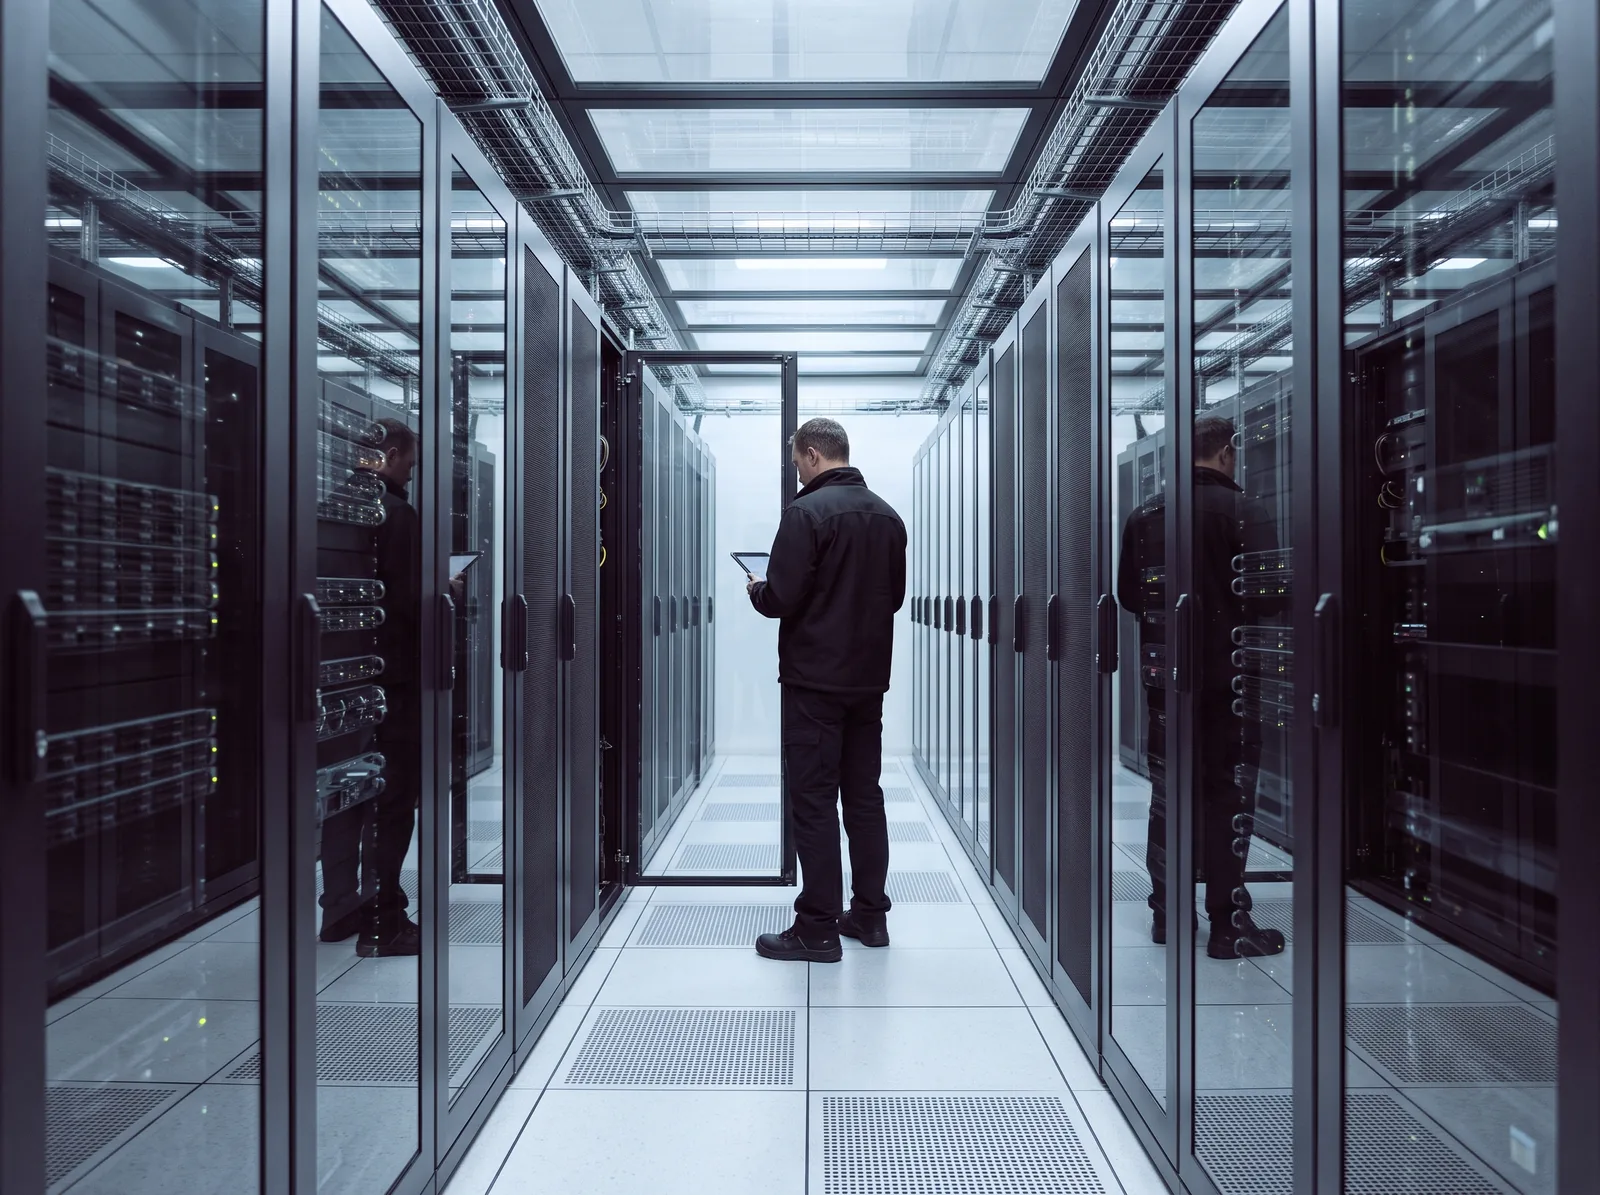
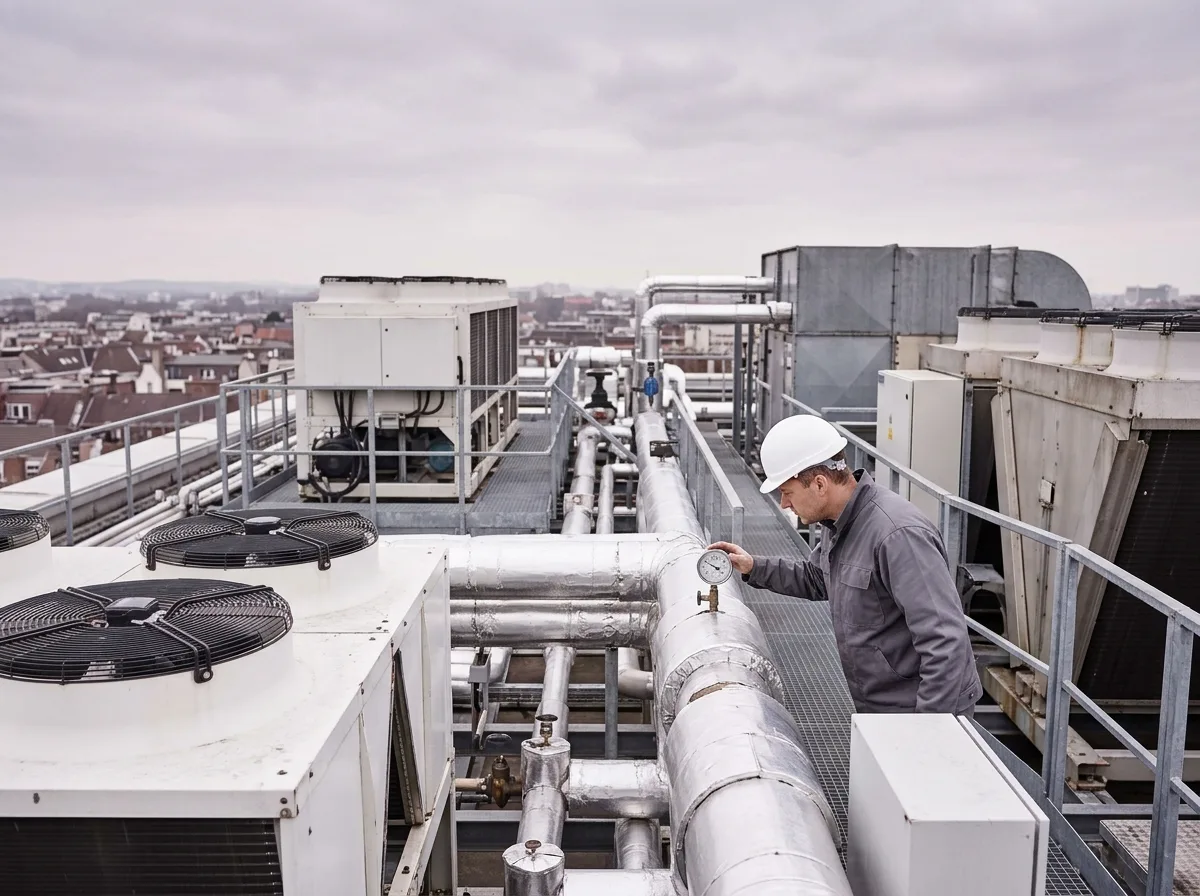
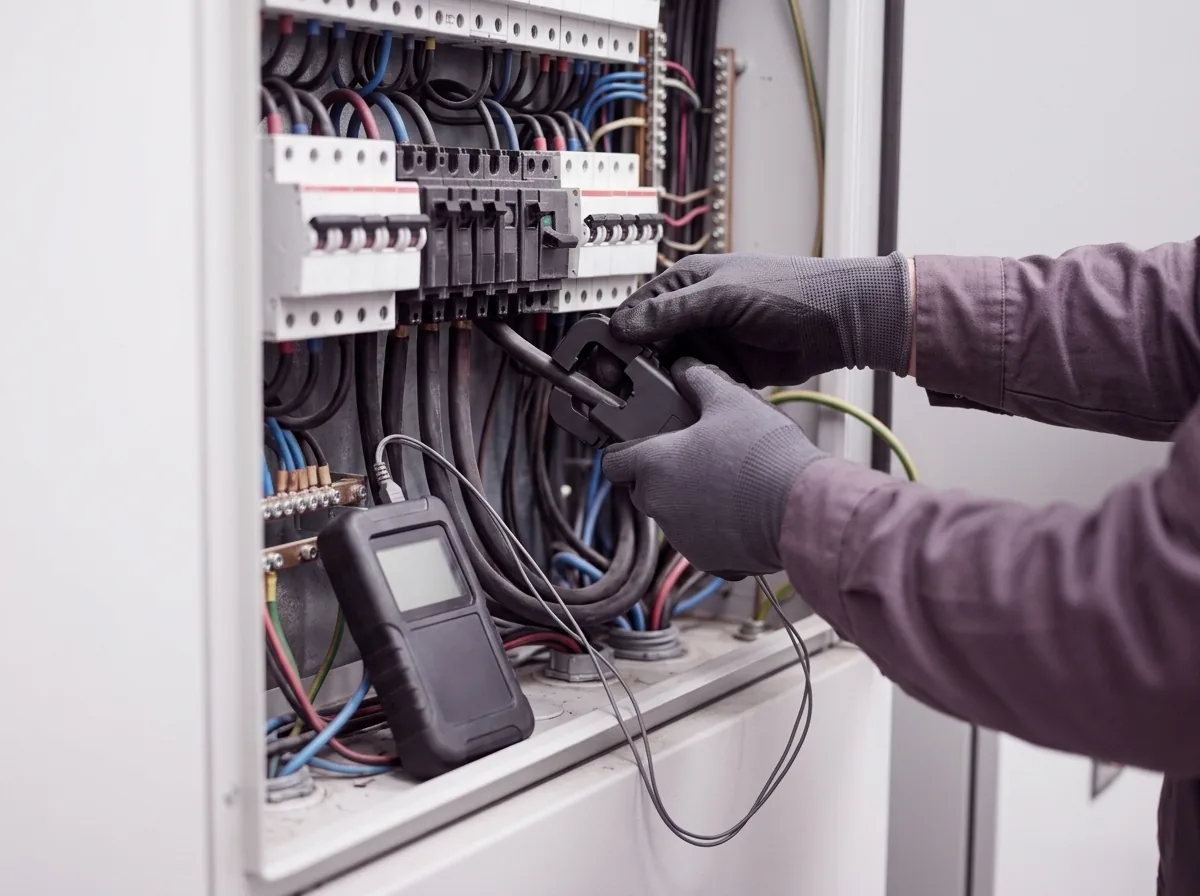
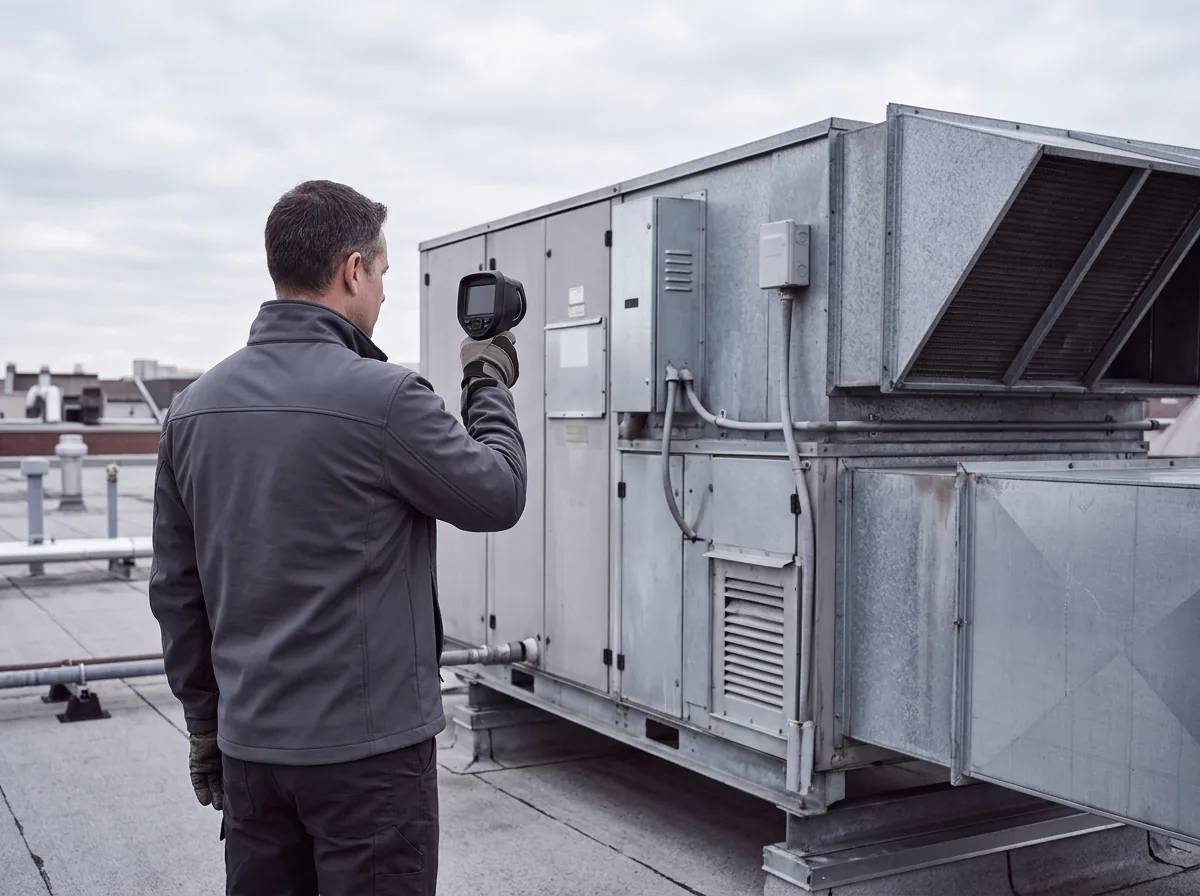
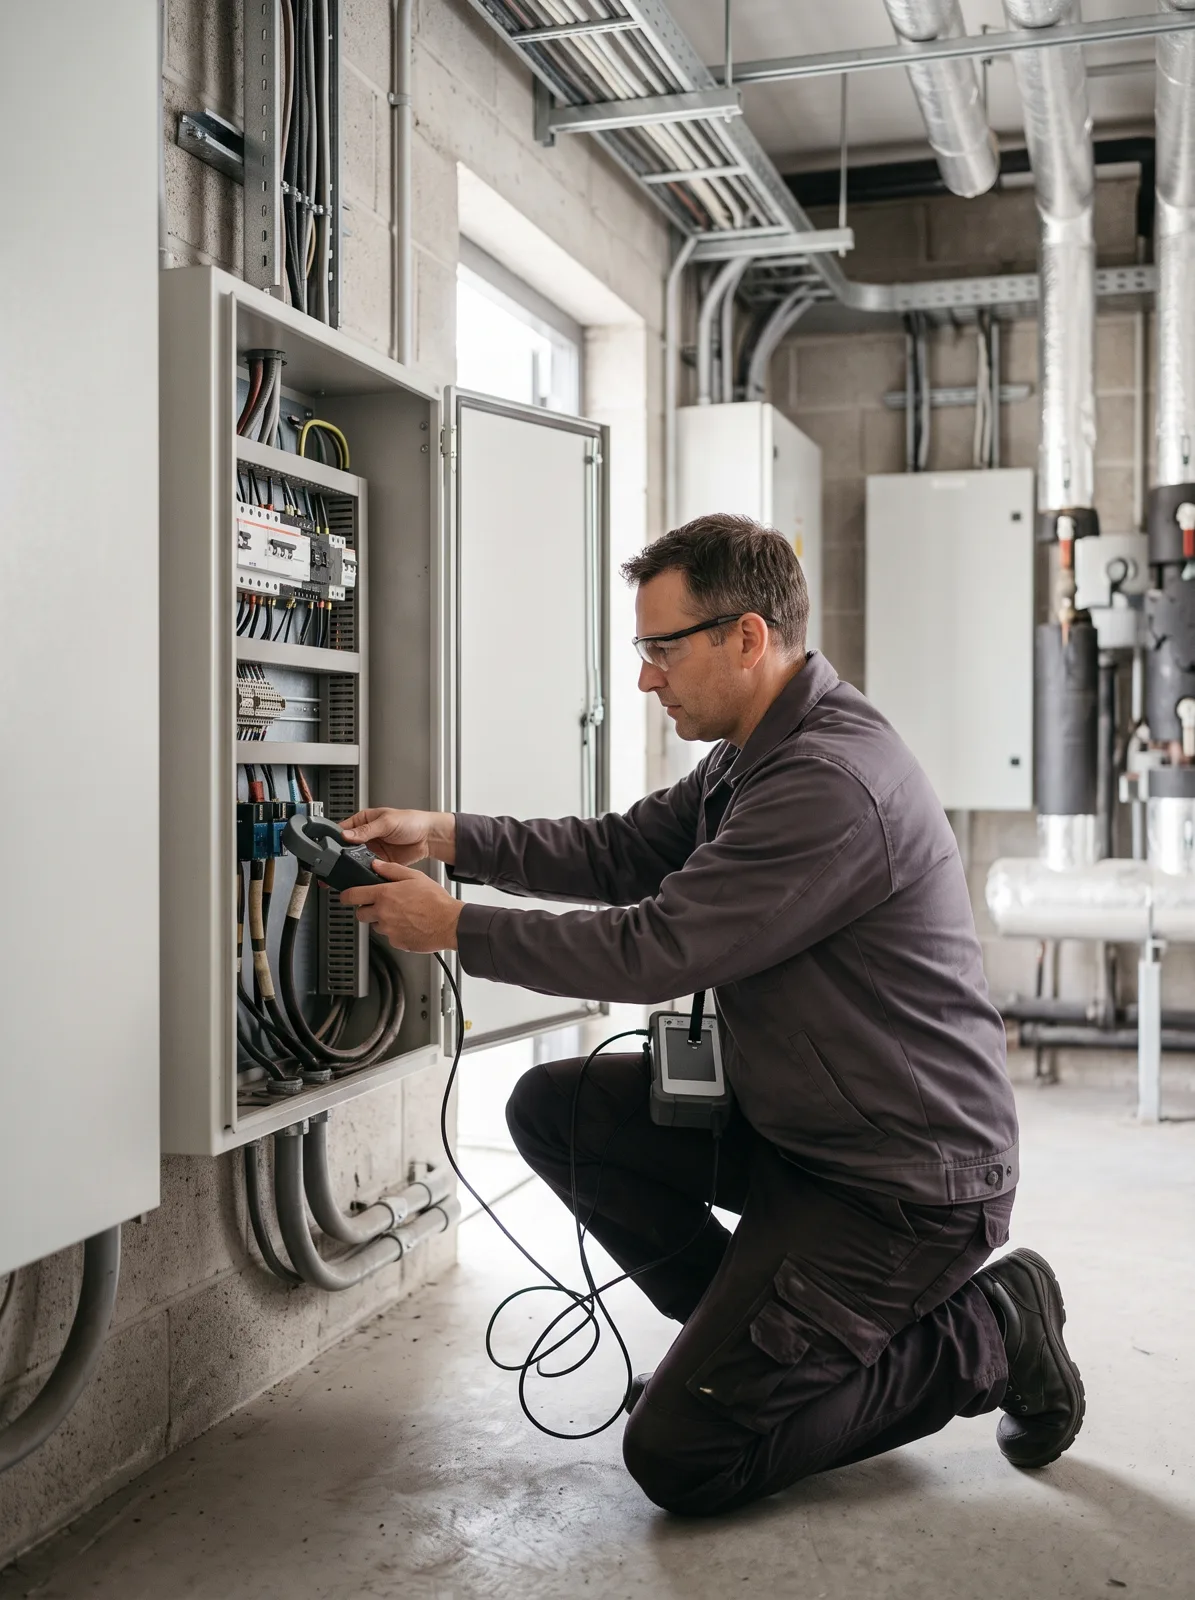
Containment went in one row at a time with the halls live; the setpoint moved in 2 °F steps over six weeks, each step checked against the rack map.