Home / Results / Fulton Square Offices
FILE KE-P13 · REV. 10/2026
[ Case KE-C08 · Commercial Offices ]

Fulton Square,
four towers re-tuned.

Four office towers whose BMS schedules still matched pre-pandemic occupancy. Re-tuning the controls and fixing fourteen rooftop units did most of it — with a 1.4-year payback.

COMMERCIAL OFFICES
EASTON, MA
1.4-YEAR PAYBACK
CASE FILE
KE-C08 · REV. 10/26
$860k/ YR
Measured saving across four towers after twelve months, occupancy- and weather-adjusted.
ENERGY CUT
27%
PAYBACK
1.4 years
ROOFTOP UNITS FIXED
14
 
ON THIS PAGE
01   Audit sheet
02   Client voice
03   Measured year
04   Timeline
01 / Audit sheet

Schedules from 2019, occupancy from 2026.

Every figure comes from the audit report, the BMS trend logs or the M&V reports. Badge data gave us real occupancy, floor by floor.
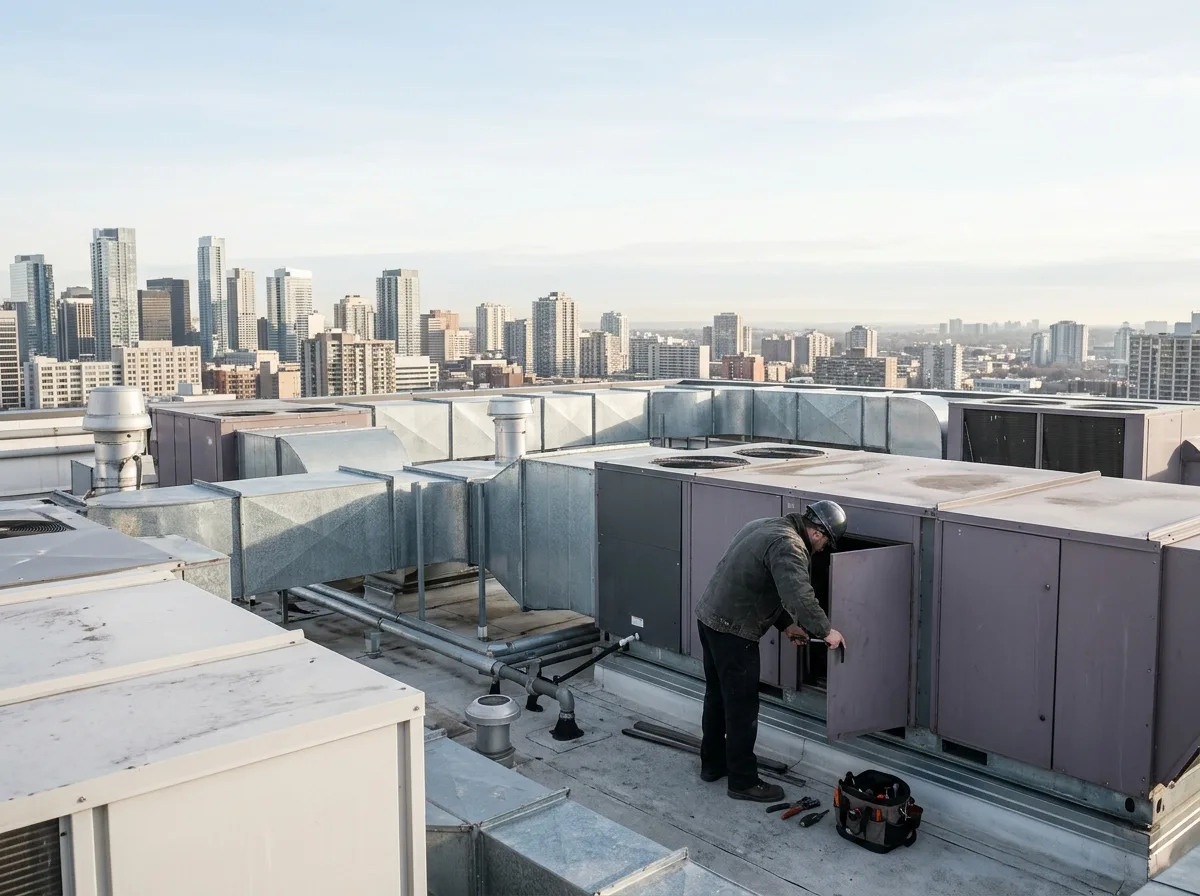
Technician opening a rooftop HVAC unit on an office tower above the city
KE-C08
LEVEL 2 AUDIT · 2024
FIG. 01 — Tower C roof, rooftop unit 6
AUDIT WEEK 2
FIG. 01 — Tower C roof, rooftop unit 6
AUDIT WEEK 2
AUDIT SHEET · KE-C08
PE STAMPED
SCOPE
4 towers · 1.3M sq ft
SERVICES
Level 2 audit · tariff review · M&V
BASELINE
21.8 GWh a year
MEASURES FOUND
19
ROOFTOP UNITS FIXED
14
SAVING (MEASURED)
$860k a year
ENERGY CUT
27%
PAYBACK
1.4 years
CHALLENGE
Floors 40% occupied on a typical day were heated, cooled and lit as if full, from 6 a.m. to 10 p.m. Fourteen rooftop units had stuck economisers or failed sensors.
OUR RESPONSE
Matched BMS schedules to badge data floor by floor, repaired the rooftop units, reset supply-air temperatures and moved two towers to a better demand tariff.
RESULT
A 27% cut measured over twelve months, $860k a year, for $1.2M of mostly controls work — and no tenant comfort complaints logged.
02 / Client voice
“Most of the saving was in software we already owned. Kestrel showed us exactly which floors and hours to change.”
NG
Nora Gallagher
GENERAL MANAGER · FULTON SQUARE
SAVING BY TOWER
M&V YEAR 1
TOWER
ESTIMATE
MEASURED
Tower A
$220k
$236k
Tower B
$205k
$214k
Tower C
$240k
$251k
Tower D
$150k
$159k
Occupancy- and weather-adjusted against 2023, IPMVP Option C per tower meter.
03 / Measured year

Cooling season, tamed.

Monthly energy across the four towers in the baseline year and the first full year after re-tuning.

MONTHLY ENERGY · BASELINE VS MEASURED (MWh)
BASELINE YEAR
MEASURED YEAR
 
1,000 MWh
 
2,000 MWh
 
3,000 MWh


JAN
FEB
MAR
APR
MAY
JUN
JUL
AUG
SEP
OCT
NOV
DEC
JAN
FEB
MAR
APR
MAY
JUN
JUL
AUG
SEP
OCT
NOV
DEC
IPMVP OPTION C
OCCUPANCY-ADJUSTED
0 COMFORT COMPLAINTS
ANNUAL ENERGY BILL
M&V YEAR 1
LINE
BASELINE
MEASURED
Electricity
$2.20M
$1.60M
Demand charges
$0.62M
$0.45M
Gas
$0.38M
$0.29M
Total a year
$3.20M
$2.34M
−27%
ENERGY, MEASURED
$860k
SAVED A YEAR
05 / Timeline

Mostly software, mostly in one quarter.

Schedules and setpoints changed tower by tower over six weeks; the rooftop repairs followed before the cooling season.


JAN 2024
 
Desk review
Weekend load at 60% of weekday across all four towers.
REVIEW
FEB 2024
 
Level 2 audit
BMS trends, badge data and every rooftop unit inspected.
AUDIT
MAR 2024
 
Re-tuning
Schedules and setpoints matched to occupancy, tower by tower.
TUNE
APR 2024
 
Rooftop repairs
14 units: economisers, sensors, belts.
INSTALL
MAY 2024
 
Tariff change
Two towers moved to a better demand rate.
TARIFF
MAY 2025
 
Year 1 verified
27% measured; monthly M&V continues.
NOW
19MEASURES
In the register
14RTUS
Repaired
1.4YR
Payback, measured
0TICKETS
Comfort complaints
MORE FROM THE REGISTER
Engineer with a tablet in a data centre cold aisle
PREVIOUS · KE-C07

Brightwater Data Centre

Data Centres · Brightwater, VA · $1.05M / yr
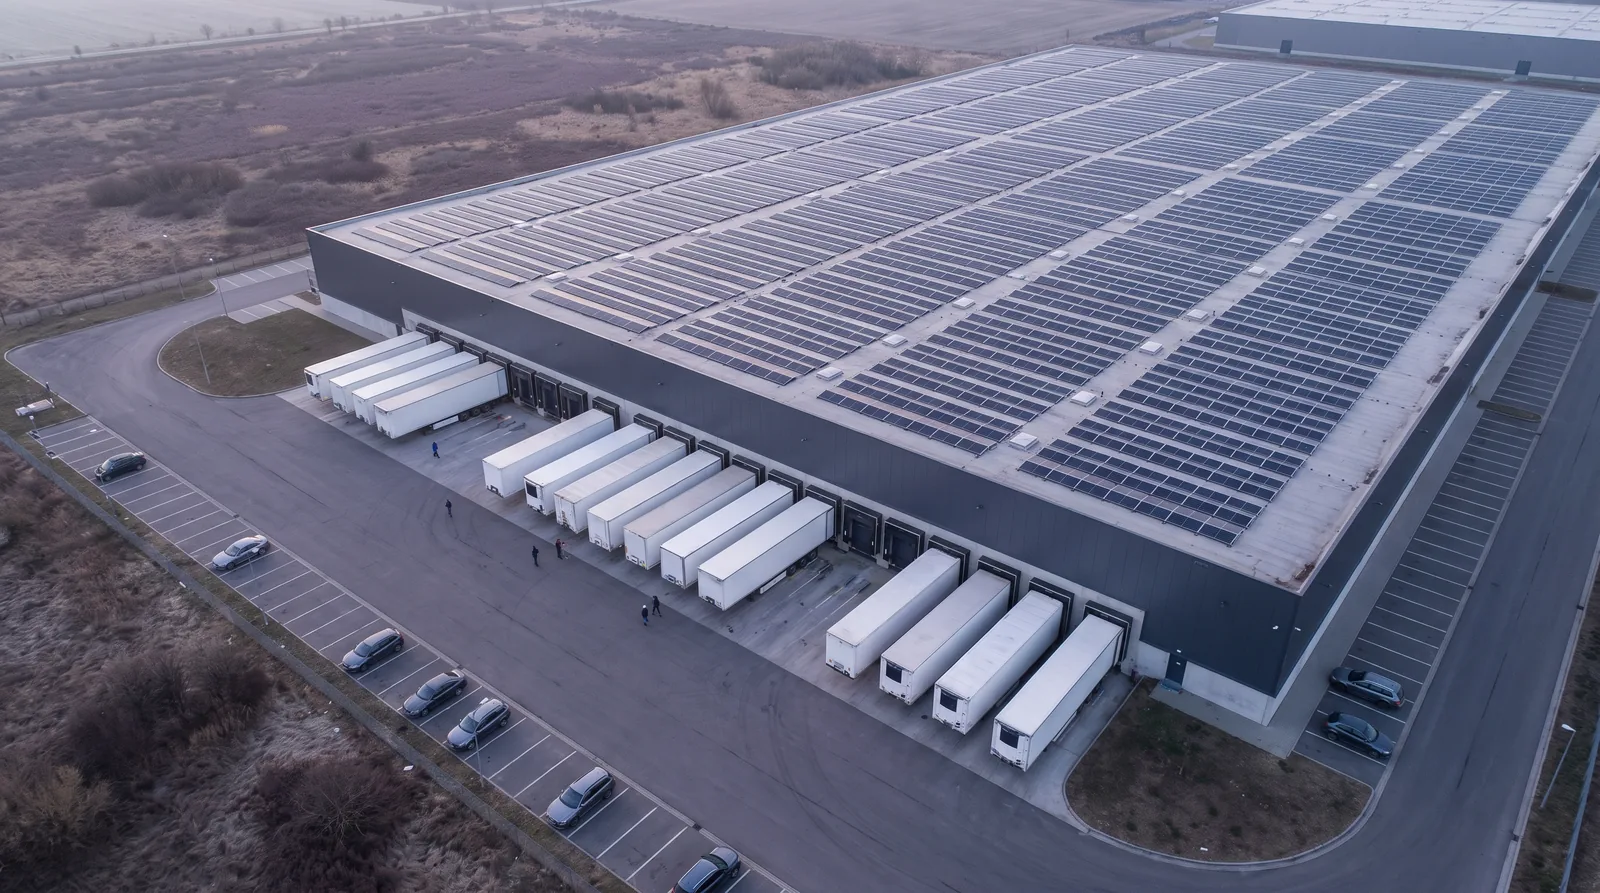
Aerial view of a logistics warehouse roof covered in solar panels
NEXT · KE-C09

Northgate Distribution

Logistics & Storage · Northgate, PA · $1.3M / yr
Next step / Free desk review

Send twelve months of bills. We will tell you where the waste probably is.

FREE · 5 WORKING DAYS · A SENIOR ADVISER CALLS, NOT A SALES TEAM