Home / Sectors
FILE KE-P07 · REV. 10/2026
[ Sectors ]

Eight sectors.
Eight kinds of waste.

A cold store loses energy in its defrost cycle, an office in its evenings, a hospital in its steam traps. Twelve years and 620 audits have taught us where each sector usually hides it — and where it doesn’t.

620 AUDITS
8 SECTOR PLAYBOOKS
TYPICAL RANGES, NOT PROMISES
SECTOR FILE
KE-SE · 2026
142AUDITS
In manufacturing, our largest sector — compressed air, process heat and motors, typically 18–31% found.
LARGEST SECTOR
Manufacturing · 142
WIDEST RANGE
Logistics · 22–38%
TIGHTEST RANGE
Data centres · 9–18%
 
ON THIS PAGE
01   Eight sectors
02   Sector sheet
03   Sector cases
04   Load profiles
Eight sectors

Every sector wastes energy differently.

Each card opens a case from that sector. The ranges are what our audit registers have typically found — modelled at audit stage, not promised.
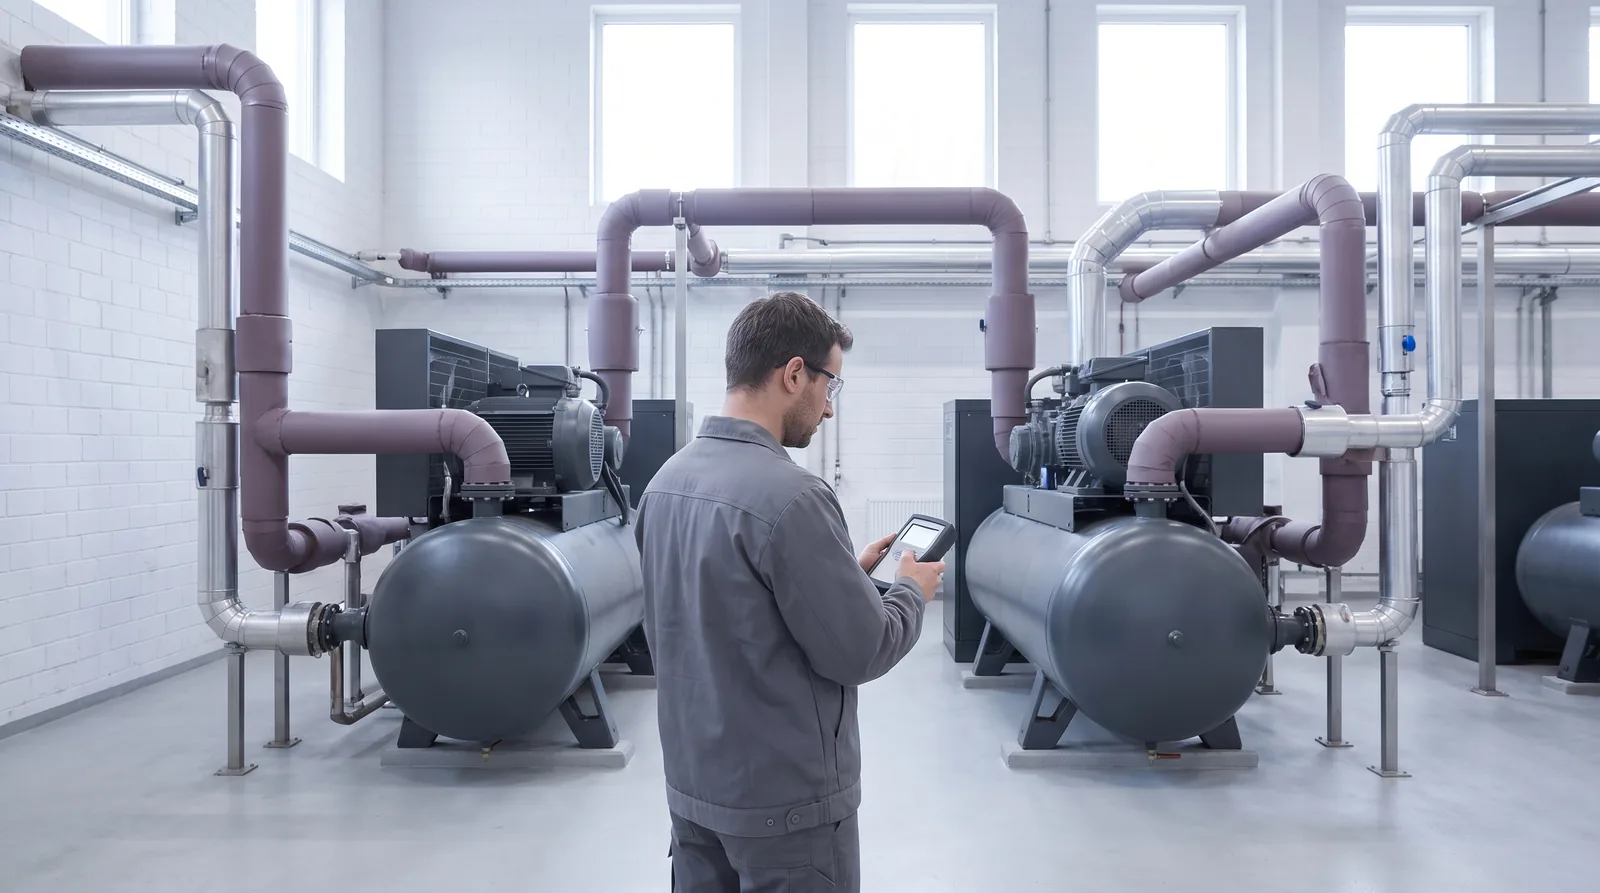
Technician reading a meter beside two industrial air compressors
KE-S1

Manufacturing

Compressed air, process heat and motors running through breaks. The night base usually tells the story.

AUDITS
142
TYPICAL SAVING
18–31%
SHARE OF 620 AUDITS
23%
Engineer with a clipboard inside a refrigerated cold store
KE-S2

Food & Cold Chain

Refrigeration that never rests: defrost cycles, open doors and head pressure set for August all year.
AUDITS
96
TYPICAL SAVING
15–26%
SHARE OF 620 AUDITS
15%
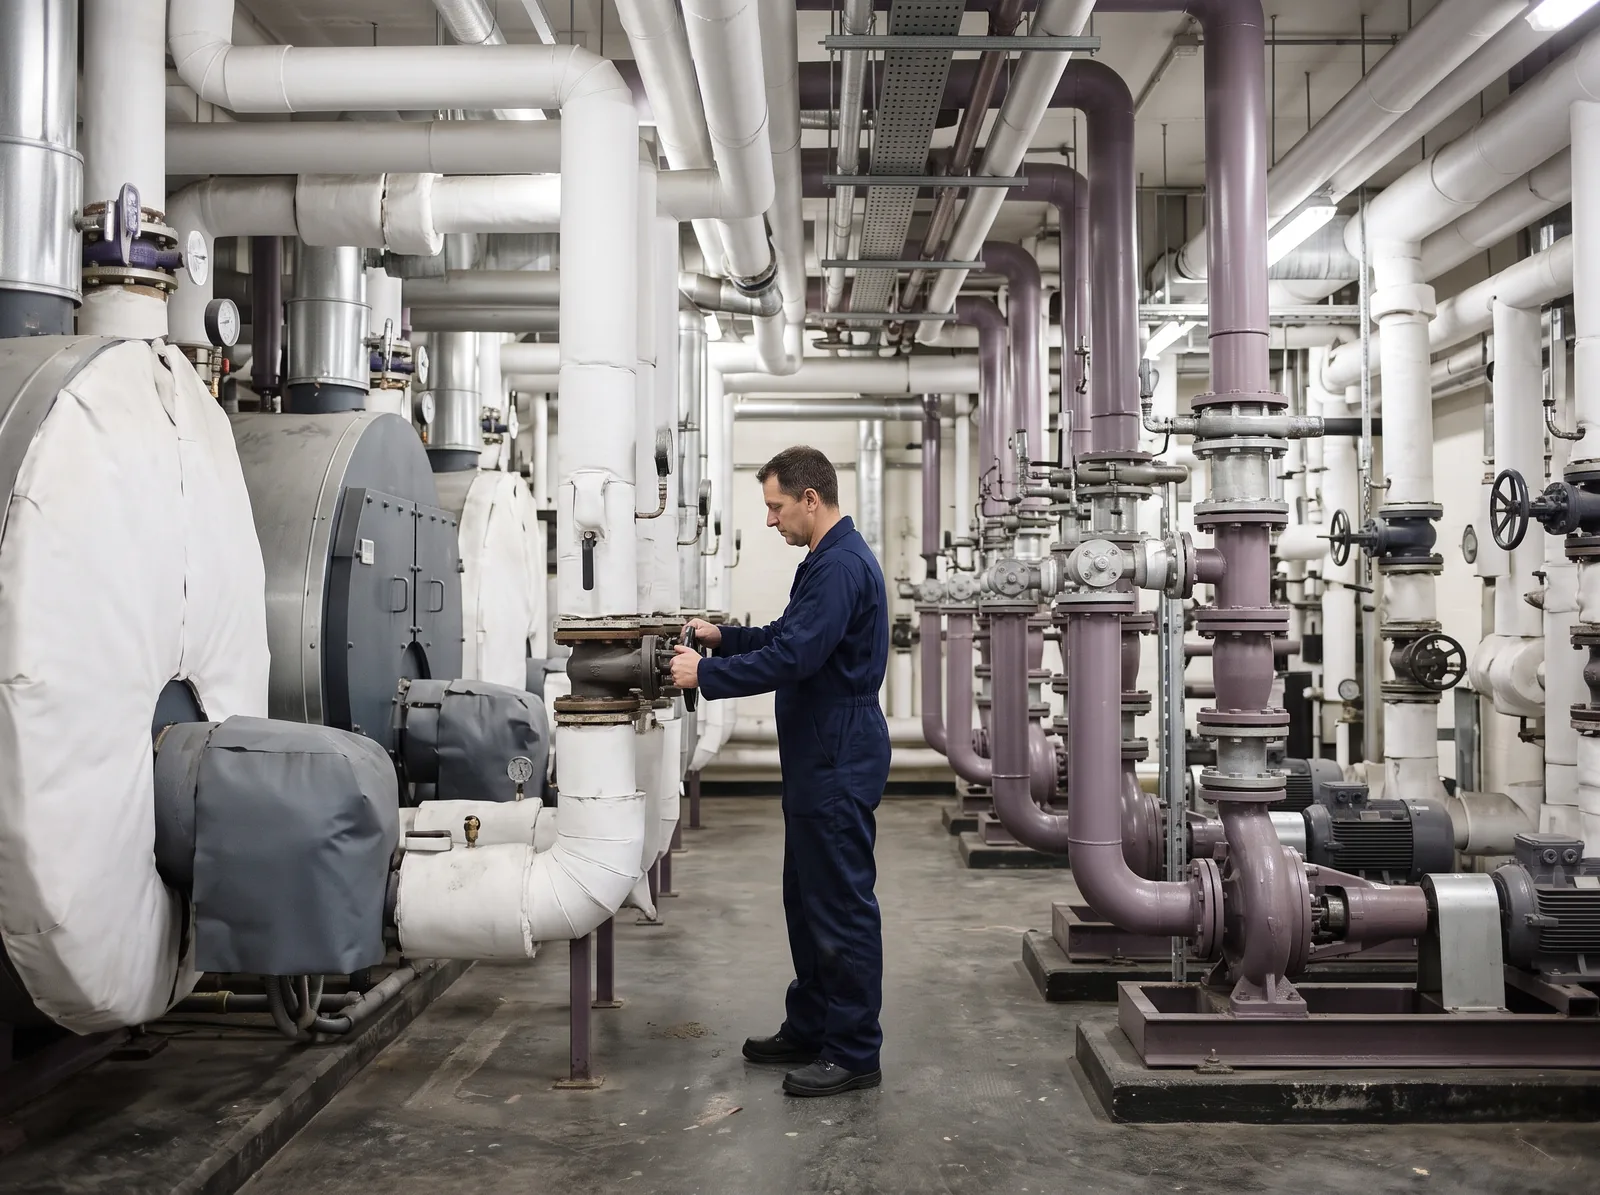
Facilities engineer inspecting a valve in a hospital boiler plant room
KE-S3

Healthcare

24/7 campuses with steam plant, strict air changes and decades of add-ons. Safety first, then savings.

AUDITS
58
TYPICAL SAVING
20–34%
SHARE OF 620 AUDITS
9%
University campus with brick teaching buildings and a modern energy centre
KE-S4

Higher Education

Old heat networks, empty buildings in summer and a board that wants a net-zero year.

AUDITS
64
TYPICAL SAVING
17–29%
SHARE OF 620 AUDITS
10%
Adviser and building manager reviewing energy graphs in a control room
KE-S5

Commercial Offices

HVAC running for tenants who left at six. Schedules and controls are where most offices start.
AUDITS
88
TYPICAL SAVING
19–33%
SHARE OF 620 AUDITS
14%
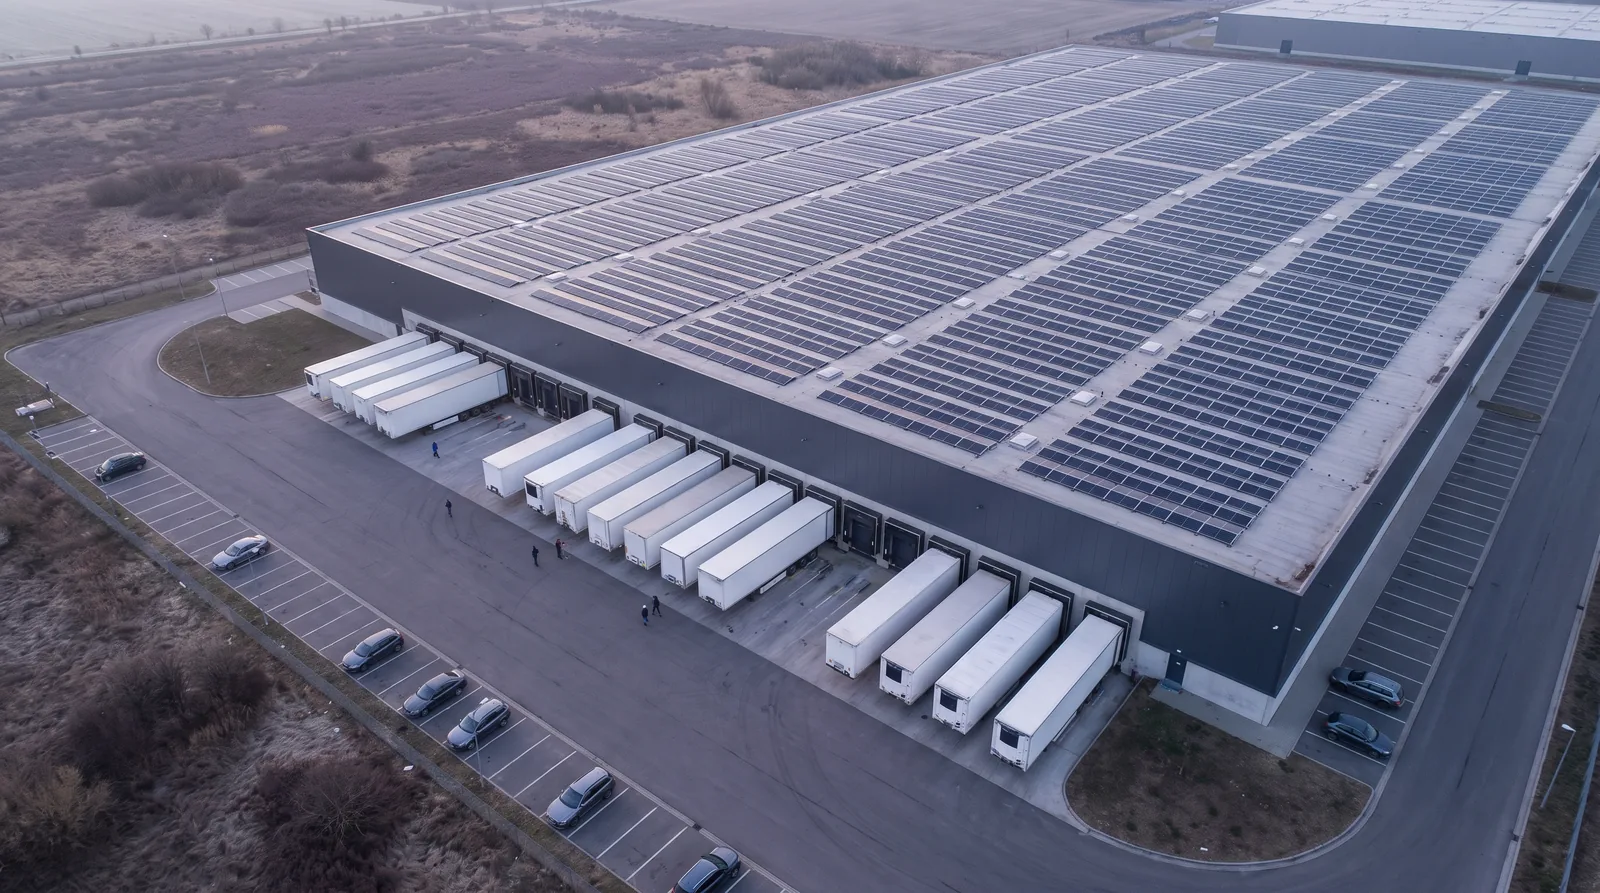
Aerial view of a logistics warehouse roof covered in solar panels
KE-S6

Logistics & Storage

Big roofs, high-bay lighting and dock doors — often the fastest paybacks, with room for solar.

AUDITS
71
TYPICAL SAVING
22–38%
SHARE OF 620 AUDITS
11%
Engineer with a tablet in a data centre cold aisle
KE-S7

Data Centres

Cooling is the lever: containment, set points and free-cooling hours, without touching uptime.

AUDITS
37
TYPICAL SAVING
9–18%
SHARE OF 620 AUDITS
6%
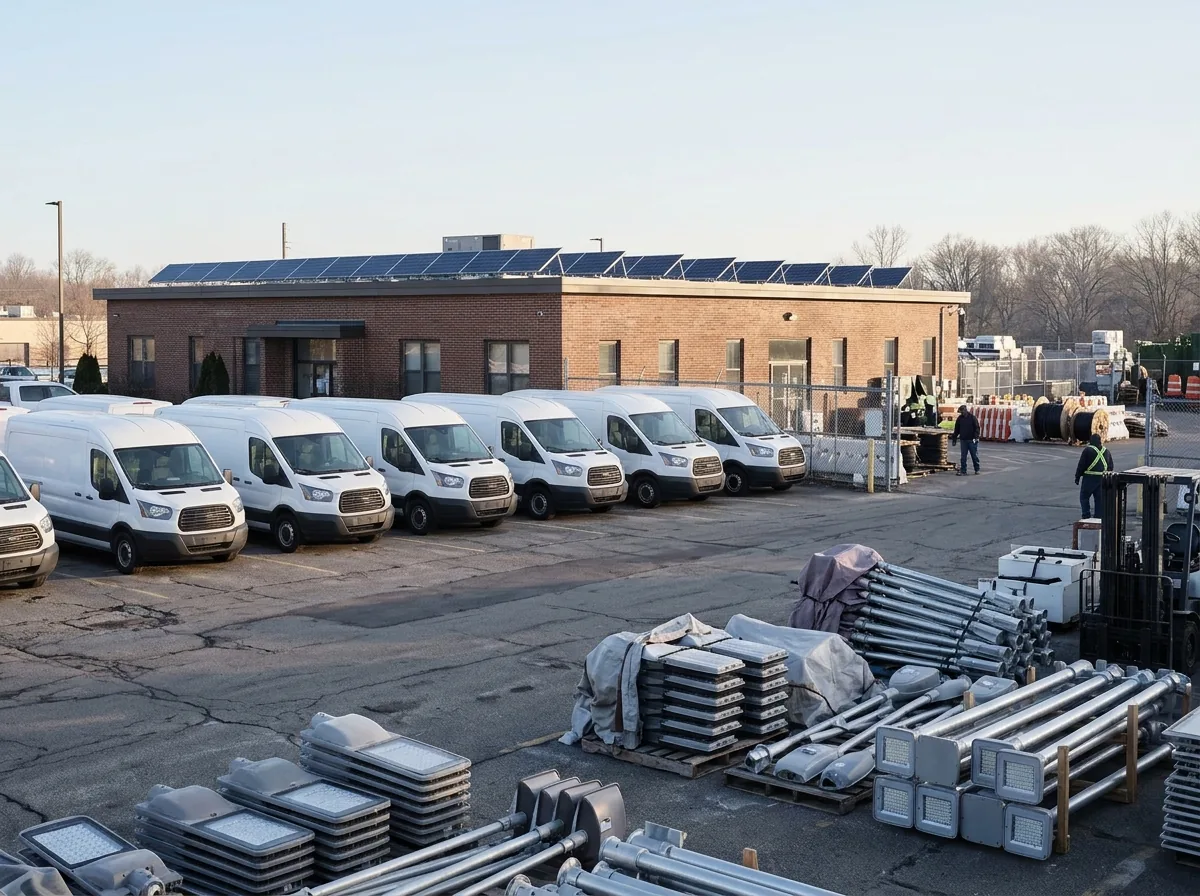
Public works depot with service vans and a solar roof
KE-S8

Public Sector

Depots, libraries and offices screened first, so audit money goes where it counts.

AUDITS
64
TYPICAL SAVING
16–30%
SHARE OF 620 AUDITS
10%
Sector sheet

Eight sectors on one sheet.

Every sector we audit, with the range of savings our registers have typically found and the measures that usually come first. Your site will differ — that is what the audit is for.

SWIPE TABLE
SECTOR
AUDITS
TYPICAL SAVING
BIGGEST END USE
FIRST MEASURES
CASE
KE-S1   Manufacturing
142
18–31%
Compressed air
Leaks, drives, heat recovery
KE-C02
KE-S2   Food & Cold Chain
96
15–26%
Refrigeration
Defrost, doors, head pressure
KE-C03
KE-S3   Healthcare
58
20–34%
Steam & HVAC
Steam traps, AHU schedules
KE-C01
KE-S4   Higher Education
64
17–29%
Heating plant
BMS schedules, heat network
KE-C04
KE-S5   Commercial Offices
88
19–33%
HVAC out of hours
Schedules, LED, controls
KE-C08
KE-S6   Logistics & Storage
71
22–38%
Lighting & docks
LED high-bays, dock seals
KE-C09
KE-S7   Data Centres
37
9–18%
Cooling
Containment, set points
KE-C07
KE-S8   Public Sector
64
16–30%
Mixed estates
Screening, LED, BMS
KE-C06
SOURCE: KESTREL AUDIT REGISTER, 2014–2026 · 620 AUDITS
RANGES ARE TYPICAL AT AUDIT STAGE, NOT GUARANTEED
Sector cases

Three sectors, three measured results.

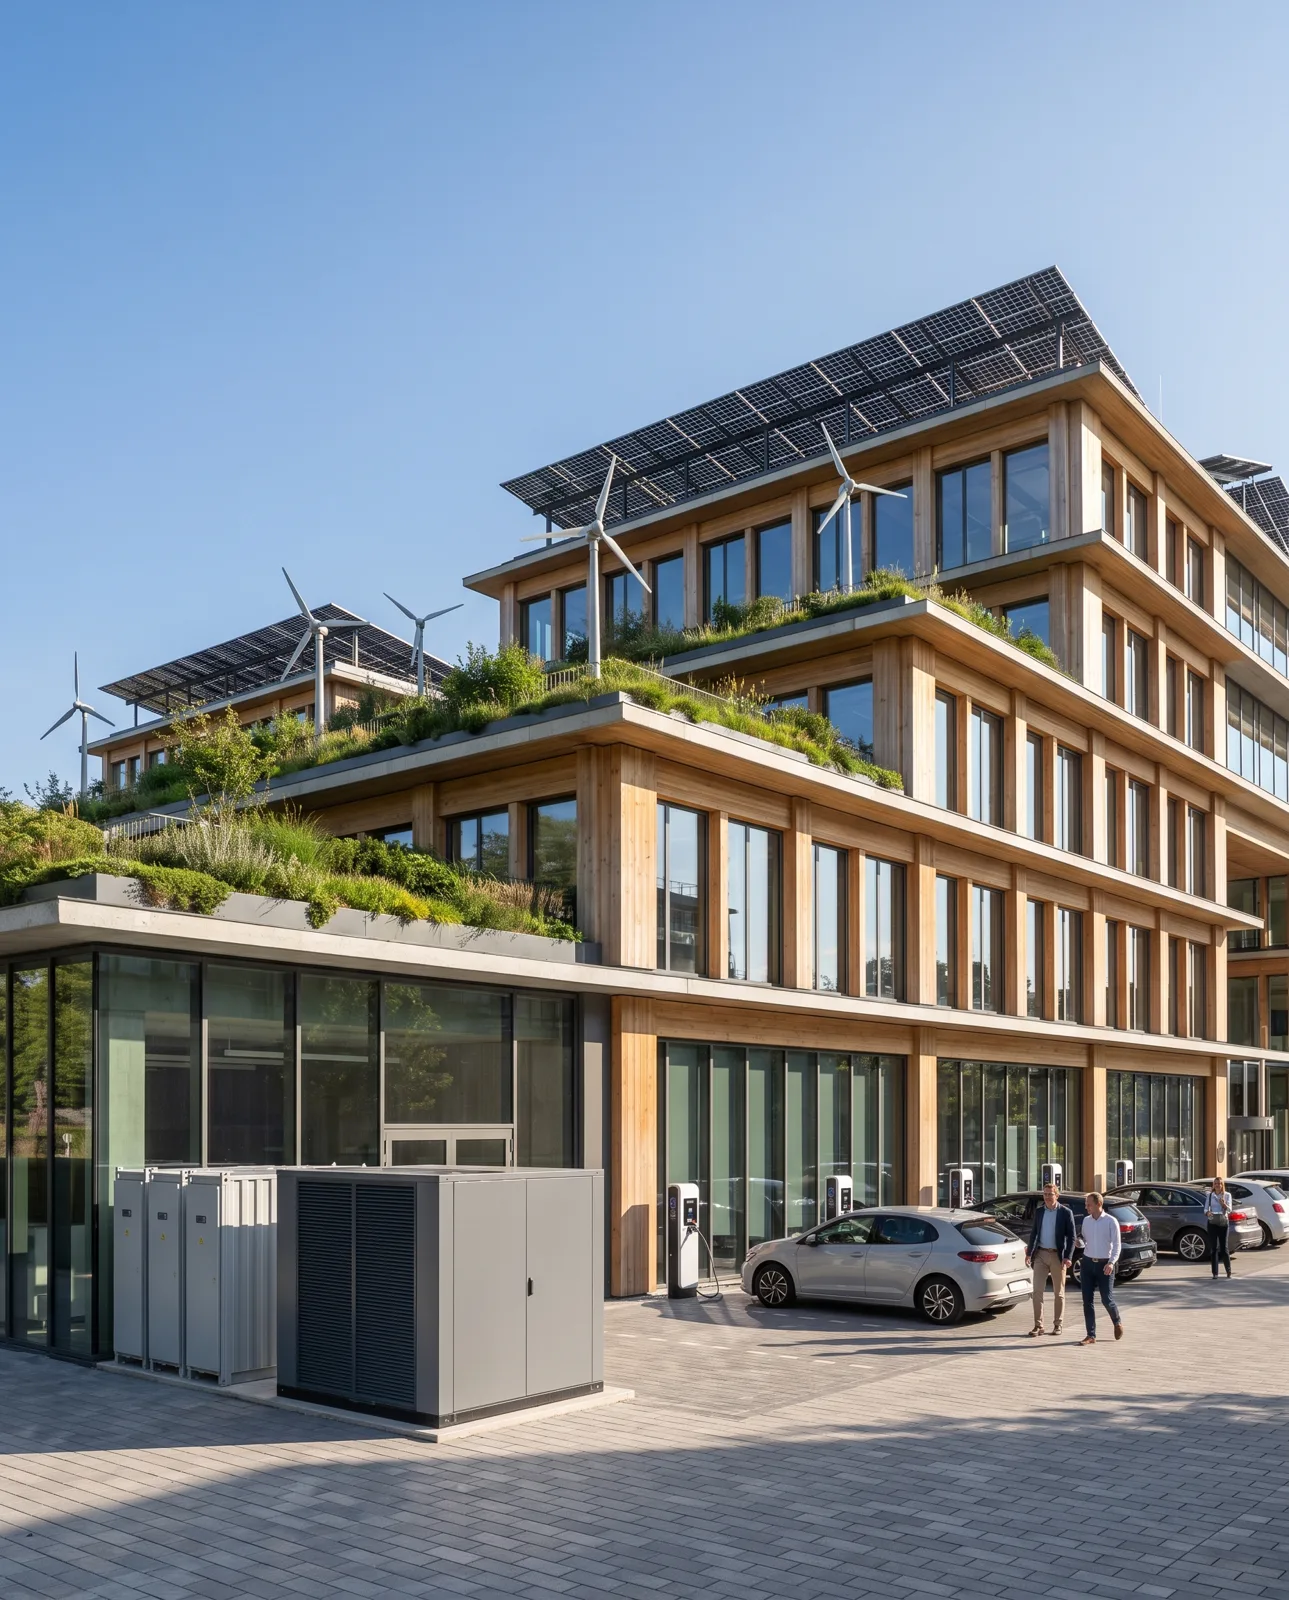
A six-storey medical office building with timber cladding, rooftop solar and planted terraces
KE-C01

Orbis Medical Campus

Healthcare · Easton, MA
ENERGY CUT
31%
SAVING
$1.4M a year
NET ZERO
2038
Engineer with a light meter under LED high-bay lights in a warehouse
KE-C09

Northgate Distribution

Logistics & Storage · Northgate, PA
ENERGY CUT
33%
SAVING
$1.3M a year
SOLAR
4.2 MW rooftop PPA
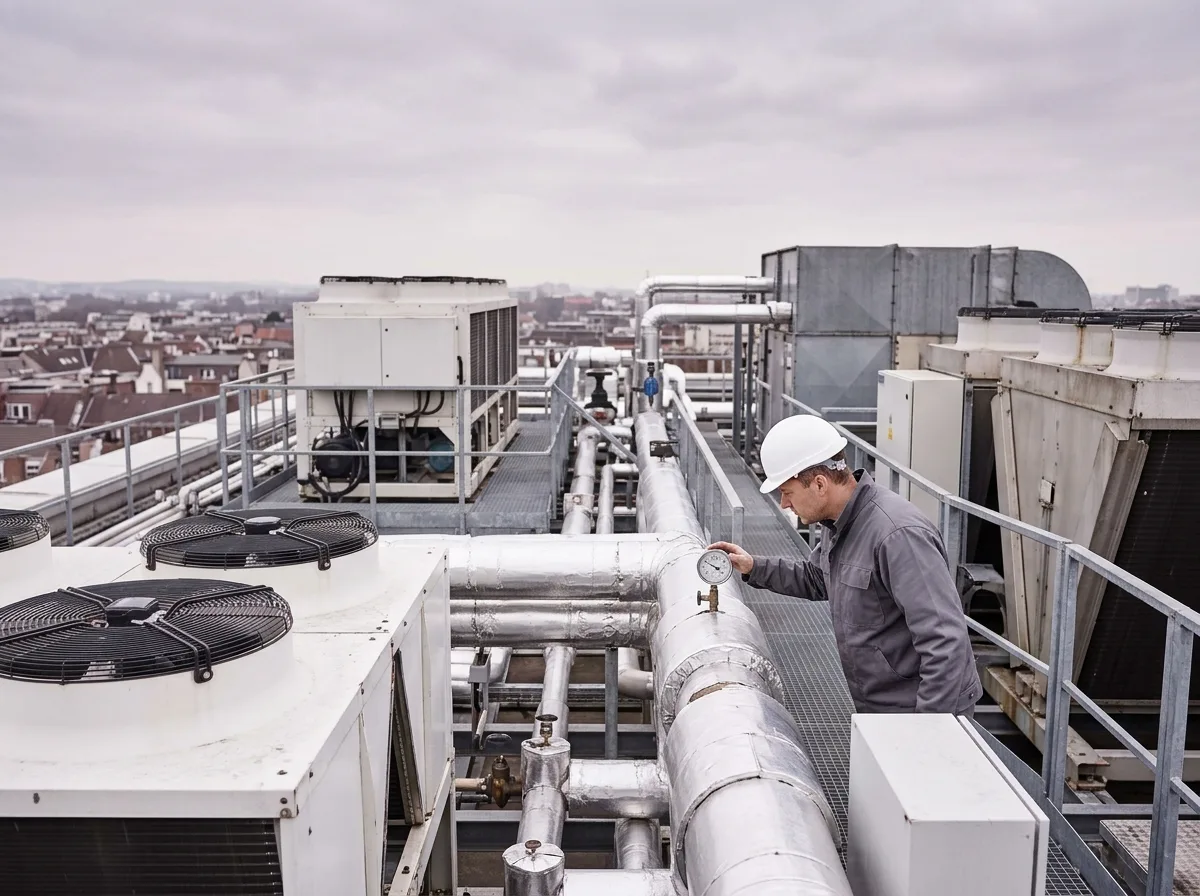
Engineer checking a gauge on a rooftop chiller plant
KE-C07

Brightwater Data Centre

Data Centres · Brightwater, VA
ENERGY CUT
14%
PUE
1.62 → 1.38
PAYBACK
2.2 years
Where the energy goes

Three load shapes, three kinds of waste.

Typical weekday profiles from our interval-data library. The accent share is the load our audits typically find avoidable — modelled, and different on every site.


 
METERED LOAD
 
TYPICALLY AVOIDABLE (MODELLED)
TYPICAL WEEKDAY · 2-HOUR BLOCKS · % OF PEAK
Manufacturing · weekday
MFG


00
06
12
18
24
PEAK
10:00 · 100%
NIGHT BASE
40–45%
TYPICAL FOUND
18–31%
Commercial office · weekday
OFFICE


00
06
12
18
24
PEAK
12:00 · 100%
NIGHT BASE
33–38%
TYPICAL FOUND
19–33%
Cold store · 24 hours
COLD


00
06
12
18
24
PEAK
14:00 · 100%
NIGHT BASE
70%
TYPICAL FOUND
15–26%
Next step / Free desk review

Send twelve months of bills. We will tell you where the waste probably is.

FREE · 5 WORKING DAYS · A SENIOR ADVISER CALLS, NOT A SALES TEAM